The American AI Opportunity Act: A Legislative Strategy for Economic Transition in the Age of Artificial Intelligence

Executive Summary: The GI Bill for the AI Age
Artificial intelligence is transforming the American workforce at unprecedented scale and speed. Between 2024 and 2035, 4.2 million American jobs face significant workforce transition from AI-driven automation, with peak displacement occurring 2028–2032 (400K–600K jobs annually). This is not theory—it is the consensus projection from McKinsey Global Institute, World Economic Forum, and OECD research, applied to current labor force data.
The United States is the only major economy without a national AI workforce strategy. China is investing $125 billion annually in AI with integrated workforce planning. The EU has mobilized €55 billion for just transition. Singapore's SkillsFuture trains 50%+ of its workforce annually. India graduates 1.5 million engineers per year. Meanwhile, the U.S. ranks 35th among OECD nations in public investment in worker retraining—spending one-fifth the OECD average.
This report presents a fundamentally new approach: the AI Workforce Investment Obligation. We're not taxing innovation. We're incentivizing companies to invest in the workforce that makes innovation possible. Companies that invest in Qualified AI Transition Funds (QAITFs) receive a 50% tax credit. Companies that don't invest pay a 25% assessment on wage-cost savings from job elimination. The investment path is the primary path—the tax is the penalty for inaction.
This is capitalism with transition responsibility—not government-directed investment. Funds are private sector-managed with public oversight, structured like SBICs (the model that funded Apple, Intel, and Costco). Fifty state-level funds, not one federal bureaucracy. Fund boards with majority private sector and labor representation, not political appointees.
Think of it as the GI Bill for the AI Age. The original GI Bill returned $6–$7 for every $1 invested and created the American middle class. This framework applies the same logic: invest in American workers during a massive economic transition, and the returns will dwarf the costs.
Report Contents: 15 Chapters
- Chapter 29: The Workforce Transition Crisis — AI's Impact on the American Workforce
- Chapter 29B: The AI Competitiveness Imperative — Why This Is a National Security Issue
- Chapter 30: The Global Response — What Governments Are Doing (and Not Doing)
- Chapter 31: Why Robot Taxes Failed — And Why This Proposal Won't
- Chapter 32: The Alvelda AI Workforce Investment Framework
- Chapter 32B: Bridging Parts III and IV — Healthcare and AI Workforce Transition
- Chapter 33: The Legal Fortress — Constitutional Defense and ERISA
- Chapter 34: The 10-State Strategy — Reform-Ready States
- Chapter 35: State-by-State Profiles and Legislative Roadmaps
- Chapter 36: Building the Bipartisan Coalition — From Labor Halls to the Chamber of Commerce
- Chapter 37: The Opposition Playbook — What They'll Say and How to Win
- Chapter 38: International Precedent — Germany, the EU, Singapore, and the Just Transition
- Chapter 39: The Five-Year Campaign — Timeline, Budget, and Decision Gates
- Chapter 40: The AI-Personalized State Legislative Engine
- Chapter 41: AI-Powered Policy at Scale — Force Multiplication for Democracy
Chapter 29: The Workforce Transition Crisis — AI's Impact on the American Workforce
The Scale of the Challenge: 4.2 Million Jobs in Transition
Key Finding: Between 2024 and 2035, artificial intelligence and automation are projected to require workforce transition for 4.2 million American workers (base case projection; range: 2.8M–6.1M under conservative and optimistic scenarios respectively). This represents 2.5% of the total 2024 U.S. workforce of 165 million employed persons. Peak displacement is expected 2028–2032, with annual transition rates reaching 400,000–600,000 jobs per year during the "crunch period."
These projections are grounded in rigorous peer-reviewed research from the McKinsey Global Institute, applied to current U.S. labor force data. McKinsey's 2023–2024 analysis projects that 14% of global workers will need occupational transition by 2030 due to automation and AI, with acceleration through 2035. For the U.S., accounting for higher AI penetration, this translates to 15–17% of the workforce experiencing significant occupational disruption—roughly 25 million people feeling some impact, with 4.2 million (base case) facing full job loss requiring transition to new occupations.
Observed vs. Projected Displacement
Disclaimer: As of March 2026, confirmed AI-attributed job losses total approximately 100,000–200,000 based on publicly reported corporate layoffs (Amazon ~14K, Microsoft ~15K, Salesforce ~4K, and others explicitly citing AI). The gap between observed (100K–200K) and projected (4.2M) reflects:
- Lag in attribution: Companies classify layoffs as "restructuring" or "efficiency" without explicitly mentioning AI, even when AI is the causal factor
- Acceleration ahead: McKinsey's 2028–2032 "peak displacement" window has not yet arrived. Current pace (200–300K/year) will accelerate to 400–600K/year by 2029
- Forward-looking nature of projections: We are in the early adoption phase. Full deployment across enterprises occurs 2026–2030
Key Insight: The Urgency Window
The gap between observed and projected displacement is precisely why immediate action is necessary. Waiting until all 4.2M jobs are documented before acting means waiting until 2032–2035 when crisis is acute. By then, political will is reactive (damage control) rather than proactive. The proactive investment window is 2025–2027. Companies that invest in workforce transition now will be better positioned competitively. States that act now will attract talent and innovation. The country that develops the best transition model will export it globally.
Sectoral Breakdown: Which Jobs First?
AI-driven workforce transition is not randomly distributed. Certain occupations face immediate, high-probability displacement (within 1–3 years), while others face longer-term risk (5–10 years).
| Sector | Current U.S. Workforce | Projected Transition (2024–2035) | % of Sector at Risk | Timeline to Peak |
|---|---|---|---|---|
| Customer Service & Call Centers | 870,000 | 615,000 | 71% | 2026–2028 |
| Administrative & Clerical | 3,200,000 | 1,440,000 | 45% | 2027–2029 |
| Data Entry & Processing | 180,000 | 150,000 | 83% | 2025–2027 |
| Finance & Accounting | 1,220,000 | 350,000 | 29% | 2027–2030 |
| Manufacturing (non-skilled) | 800,000 | 280,000 | 35% | 2028–2032 |
| IT & Programming (junior roles) | 1,670,000 | 200,000 | 12% | 2028–2032 |
| Professional Services (paralegal, junior analyst) | 950,000 | 200,000 | 21% | 2028–2032 |
| Retail & Checkout | 3,600,000 | 900,000 | 25% | 2026–2030 |
| Transportation & Logistics (pre-autonomous vehicle) | 3,500,000 | 225,000 | 6% | 2030–2035 |
| Total (all sectors) | 165,000,000 | 4,200,000 | 2.5% | 2024–2035 |
State-Level Impacts: Geographic Concentration
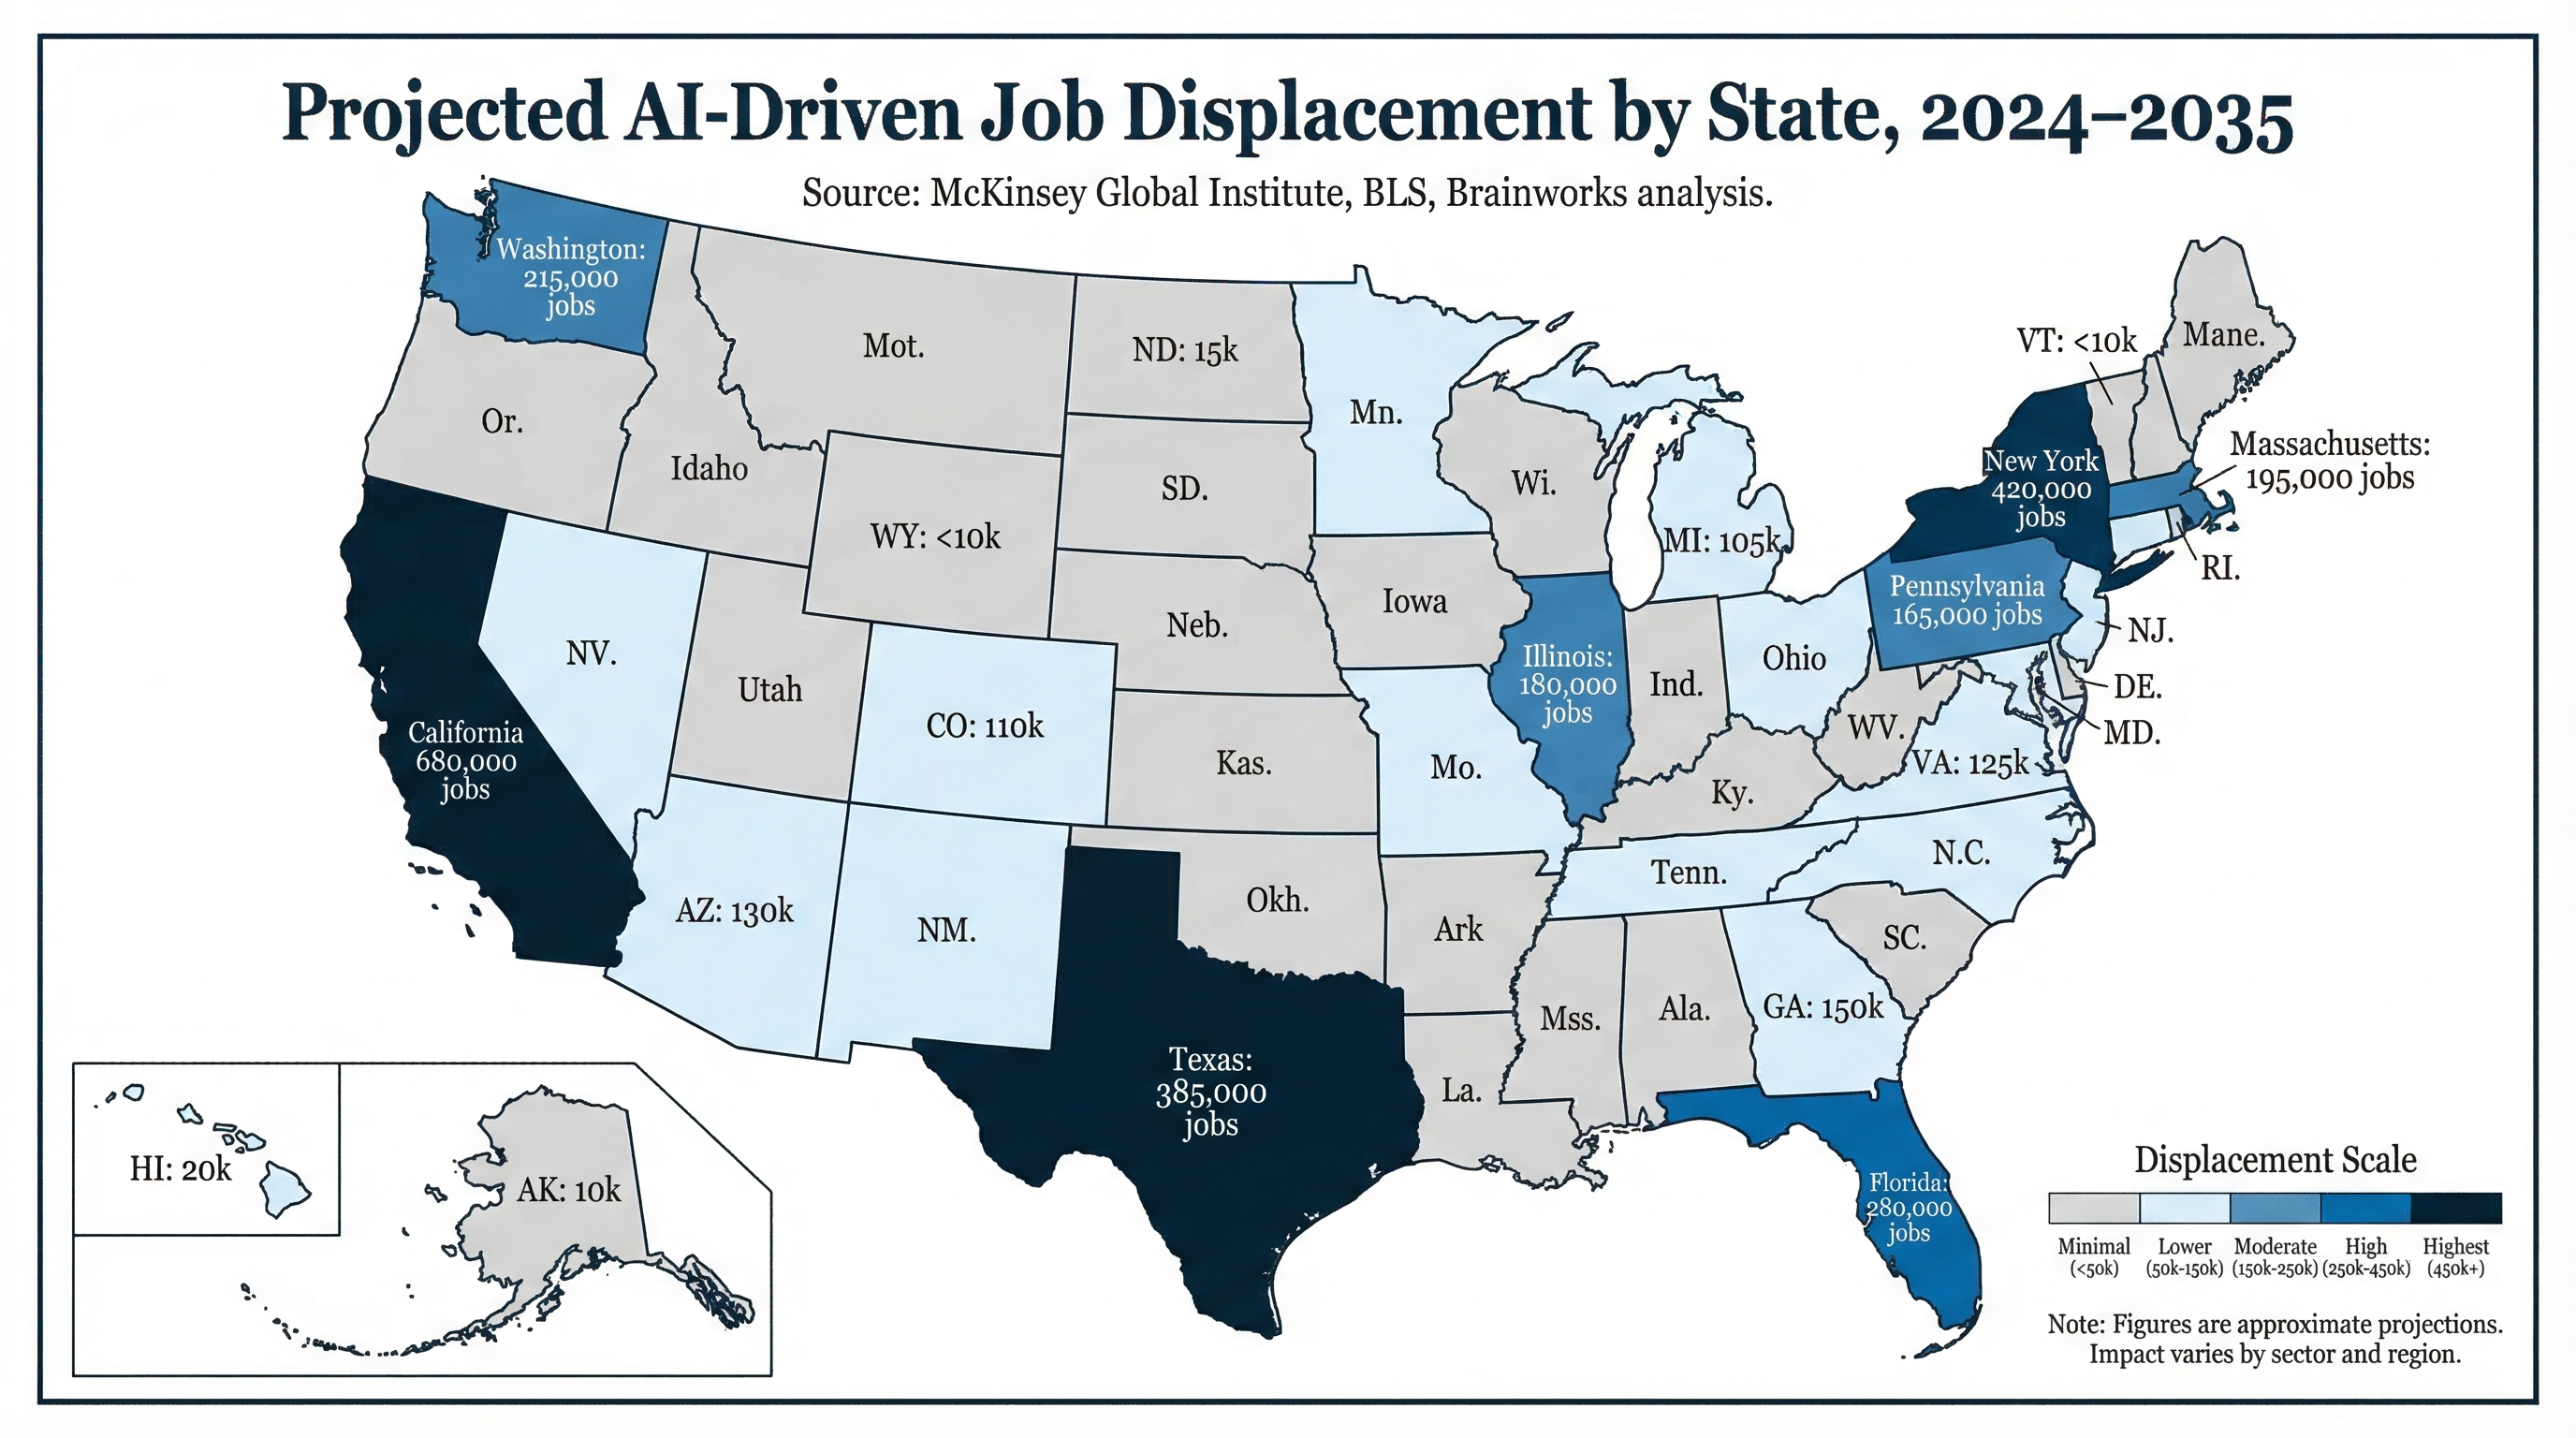
AI workforce transition is not uniformly distributed geographically. States with high tech sector concentration, high administrative workforce density, and existing customer service clusters face disproportionate impact.
California (680,000 workers in transition; 16% of state employment): Concentration in SF Bay Area (240K), Los Angeles (185K), San Diego (95K). Tech sector (120K), administrative (180K), customer service (95K) most affected. Average wage of transitioning workers: $62,000.
New York (420,000; 11% of state employment): Finance sector (95K), administrative (120K), tech (65K), customer service (75K). NYC concentration (310K), upstate regions (110K). Average wage: $71,000.
Texas (385,000; 6% of state employment): Tech (75K), manufacturing (95K), administrative (85K), customer service (70K). Distributed across Austin (95K), Dallas (125K), Houston (85K). Average wage: $54,000. Texas's inclusion is critical for bipartisan credibility — this is not a blue-state problem.
Washington (215,000; 7% of state employment): Tech sector concentration (65K). Seattle metro (145K), Puget Sound (70K). Average wage: $63,000.
Massachusetts (195,000; 6% of state employment): Boston area (120K). Finance, tech, professional services heavy. Average wage: $72,000.
Ohio (185,000; 3.4% of state employment): Manufacturing (65K), healthcare admin (40K), financial services (35K), logistics (25K). Columbus (80K), Cleveland (55K), Cincinnati (30K). Average wage: $48,000. Ohio represents the manufacturing heartland — post-industrial communities that already experienced the offshoring wave and cannot afford another unmanaged transition.
Georgia (170,000; 3.5% of state employment): Financial services (45K), logistics (40K), customer service (35K), healthcare admin (25K). Atlanta metro (130K). Average wage: $52,000. Georgia's emergence as a tech hub makes it a critical swing state for AI workforce policy.
Remaining states (1,950,000 displaced): Distributed broadly; lower concentration but meaningful impact in manufacturing and customer service hubs (Midwest, South, Southwest).
Why This Is Different From Prior Automation Waves
Speed: Prior automation (manufacturing 1980s–1990s, offshoring 1995–2010) unfolded over 15–20 years. AI displacement is compressed into 5–8 years of peak impact (2028–2035), leaving less time for organic workforce adaptation.
Scope: Manufacturing automation affected specific sectors and geographies (Rust Belt, labor-intensive manufacturing). AI affects all sectors simultaneously—customer service, finance, professional services, tech, retail, manufacturing, healthcare support, education. No sector is immune.
Skill portability: Manufacturing automation displaced workers with specific technical skills who could retrain into adjacent industrial roles. AI displaces workers across the entire education spectrum—from customer service reps with high school education to financial analysts with bachelor's degrees to programmers with master's degrees—requiring differentiated transition pathways.
Critical Lesson: The Offshoring Wave We Failed to Manage
From 2000 to 2010, the U.S. lost 5.8 million manufacturing jobs—nearly one-third of the manufacturing workforce—in the offshoring wave. Workers displaced experienced permanent wage losses of 15–30%, even with retraining. The policy response was inadequate: Trade Adjustment Assistance reached only a fraction of displaced workers at $12K per worker. The result was the Rust Belt decline, the opioid crisis, deaths of despair, and decades of community collapse that persist to this day. AI displacement will hit more sectors, more simultaneously, and faster. We have the opportunity to learn from that failure—or to repeat it at larger scale.
Chapter Conclusion
AI-driven workforce transition is imminent, large-scale (4.2M workers), and accelerating. It differs fundamentally from prior automation waves in speed, scope, and skill diversity. The window for proactive investment is 2025–2027. After that window closes, policy becomes reactive crisis management rather than strategic workforce investment. The question is not whether to invest in American workers—it's whether we do it now, when it's effective and affordable, or later, when it's expensive and too late.
Chapter 29B: The AI Competitiveness Imperative — Why This Is a National Security Issue
The Global AI Race Is a Workforce Race
The United States leads the world in AI research, but it is falling behind in the race that ultimately matters: preparing its workforce for the AI economy. While America debates whether to act, every major competitor is investing aggressively in workforce transition. The country that solves the AI workforce challenge first doesn't just protect its workers—it gains a decisive competitive advantage in the defining industry of the 21st century.
The Uncomfortable Truth
The United States is the only major economy without a national AI workforce strategy. China has one. The EU has one. Singapore has one. India has one. South Korea, Japan, Germany—they all have national plans for managing the AI workforce transition. The United States, the country that invented modern AI, has no plan.
What Our Competitors Are Doing
China: Total AI investment of ¥890 billion ($125 billion) in 2026—38% of global AI investment, growing 18% year-over-year. The State Council's "AI Plus" initiative explicitly links AI deployment to job creation and workforce upgrading. China's approach integrates workforce retraining directly into AI industrial policy—not as an afterthought but as a core objective. Beijing, Shenzhen, and Shanghai account for 71% of total AI investment. Projection: Chinese AI investment expected to reach ¥1.42 trillion ($200B) by 2030, with 5 million+ AI workers by that date.
European Union: The EU Just Transition Mechanism has mobilized approximately €55 billion across three pillars—€19.3B in direct grants for worker retraining and economic diversification, €10-15B in private investment leverage, and €13-15B in public infrastructure loans. The EU AI Act (effective 2024–2026) includes requirements for AI literacy and workforce impact assessments. Member states are implementing AI-specific reskilling programs: Belgium's DigiSkills, Czechia's subsidized digital retraining, Denmark's digital problem-solving program.
Singapore: SkillsFuture provides every citizen aged 25+ with training credits for approved courses. Citizens aged 40+ receive S$600 annually plus a $300/month mid-career training allowance. The program has achieved 50%+ workforce participation since 2015 and 70% job transition success rates. Cost per worker: ~$750/year. Singapore's Skills Demand for the Future Economy Report maps skills requirements across all sectors annually. This is what a national workforce strategy looks like.
India: Produces approximately 1.5 million engineering graduates per year—more than any other country. AI/ML employability among graduates: 46%. Demand for AI/ML roles surged 39% in 2025. While quality remains a challenge (57% of graduates not immediately employable), the sheer scale of India's pipeline represents a massive global talent supply that U.S. companies already rely on through H-1B visas.
The U.S. Retraining Deficit
The United States ranks near the bottom of OECD countries in public investment in active labor market policies—the category that includes worker retraining and reskilling:
| Country | Active Labor Market Spending (% GDP) | Multiple of U.S. Spending |
|---|---|---|
| Denmark | ~2.0% | 20x |
| Sweden | ~1.2% | 12x |
| France | ~1.0% | 10x |
| Germany | ~0.6% | 6x |
| OECD Average | ~0.5% | 5x |
| United States | ~0.1% | — |
The U.S. spends roughly one-fifth the OECD average on active labor market policies as a share of GDP. Nordic countries invest 10–20x more per worker on retraining than the United States. The OECD Skills Outlook 2025 emphasized that "strong collaboration among governments, social partners, and learners is essential" and warned that countries with weak retraining infrastructure face the most painful transitions.
The Defense Industrial Base: Who Operates the Fabs?
The CHIPS Act invested $52.7 billion in semiconductor manufacturing—including $39 billion for manufacturing incentives and $13.2 billion for R&D and workforce training. Intel alone received $7.86 billion, including $65 million for semiconductor workforce development. This was a bipartisan recognition that strategic industries require workforce investment.
But the defense workforce gap extends far beyond semiconductors. The defense manufacturing workforce gap is projected to widen to approximately 2.1 million workers by 2030. Skilled labor shortages are causing persistent delays in critical military programs, including Columbia-class and Virginia-class submarine construction. And 77% of young Americans (ages 17–24) would not qualify for military service without a waiver—a population health crisis driven partly by inadequate healthcare access (see Chapter 32B).
The CHIPS Act established a critical precedent: bipartisan willingness to condition industrial subsidy on workforce investment. The AI Workforce Investment Obligation extends this same logic to the broader AI economy. If we can require workforce investment for semiconductor fabs, we can require it for AI-driven workforce transitions.
The "Hollowing Out" Risk: What Happens Without a Plan
We have a detailed case study of what happens when a major economic transition occurs without a workforce strategy: the manufacturing automation and offshoring wave of 1980–2010.
- U.S. manufacturing employment was remarkably stable for 35 years (16.5–19.5M workers, 1965–2000), then collapsed: 5.8 million jobs lost 2000–2010—nearly one-third of the total
- The "China shock" was far larger than most economists predicted. Early projections underestimated both the speed and scale of displacement
- Communities dependent on manufacturing experienced cascading economic, social, and political consequences: the Rust Belt decline, opioid crisis, deaths of despair
- Trade Adjustment Assistance was chronically underfunded and reached only a fraction of displaced workers
- The policy failure wasn't that transition was impossible—it was that we didn't invest in transition before it was too late
AI displacement will hit more sectors, more simultaneously, and faster than the manufacturing wave. Customer service, finance, professional services, tech, retail, manufacturing, healthcare support—no sector is immune. If we fail to manage this transition, the consequences will make the Rust Belt look like a warmup.
First-Mover Advantage: The Transition Model as Export
There is a profound economic opportunity in getting this right. The country that develops the best AI workforce transition model doesn't just protect its own workers—it exports that model globally. Every nation on earth will face AI workforce transition. The frameworks, institutions, technologies, and best practices that emerge from successful management of this transition will be in demand worldwide.
This is the same dynamic that made American higher education, financial markets, and technology ecosystems global templates. The GI Bill didn't just educate veterans—it created the model of mass higher education that countries worldwide adopted. A successful AI Workforce Investment framework could do the same for workforce transition.
The Competitiveness Scorecard
| Metric | United States | China | EU | Singapore | Assessment |
|---|---|---|---|---|---|
| AI Research Leadership | 🟢 #1 | 🟡 #2 | 🟡 #3 | 🟡 Niche | U.S. leads |
| AI Investment (2026) | 🟢 ~$180B | 🟡 $125B | 🟡 ~$60B | 🟡 ~$5B | U.S. leads |
| National AI Workforce Strategy | 🔴 None | 🟢 AI Plus | 🟢 Just Transition | 🟢 SkillsFuture | U.S. lags badly |
| Worker Retraining (% GDP) | 🔴 0.1% | 🟡 ~0.3% | 🟢 0.5%+ avg | 🟢 ~1.5% | U.S. worst in OECD |
| Healthcare Burden on Employers | 🔴 $15K+/worker | 🟢 $1-2K | 🟢 $4-6K | 🟢 $1.5-2.5K | 3-10x competitors |
| STEM Graduate Pipeline | 🟡 Strong | 🟢 Massive | 🟡 Moderate | 🟡 Small/Elite | Reliant on imports |
| Defense Workforce Readiness | 🔴 2.1M gap by 2030 | 🟡 Growing | 🟡 Mixed | 🟢 Strong | Critical shortage |
| Community Resilience | 🔴 Rust Belt legacy | 🟡 Managed | 🟢 Social safety net | 🟢 Strong | Unmanaged transitions |
The Conservative Case for Action
This is not a progressive cause. This is a national competitiveness imperative with strong conservative economic arguments:
- Market failure correction: Companies that automate jobs externalize transition costs to taxpayers (unemployment insurance, social services, public health). The AI Workforce Investment Obligation corrects this market failure by requiring companies to internalize costs they create—the same principle underlying environmental cleanup requirements.
- Moral hazard prevention: Without transition requirements, companies have incentive to automate aggressively while shifting worker transition costs to the public. This creates moral hazard. The investment obligation aligns private incentives with public outcomes.
- Human capital preservation: Workers are assets, not costs. A displaced worker who loses skills, health, and community connections represents destroyed human capital that took decades to build. Investment in transition preserves that capital.
- Community stability: Unmanaged displacement destabilizes communities—as the Rust Belt proved. Stable communities are prerequisites for business investment, property values, and civic participation. Transition investment protects community stability.
- National defense: The defense industrial base requires skilled workers. The 2.1 million worker gap threatens weapons production and military readiness. Workforce transition investment feeds the defense talent pipeline.
- Fiscal responsibility: The cost of inaction ($123K per displaced worker in unemployment, social services, and public health) exceeds the cost of proactive investment ($110K per worker). Transition investment saves taxpayer money.
Chapter Conclusion
The AI competitiveness race is ultimately a workforce race. America's lead in AI research means nothing if our workers can't participate in the AI economy. Every major competitor has a national workforce strategy; we don't. The CHIPS Act proved bipartisan support exists for conditioning industrial investment on workforce development. The AI Workforce Investment Obligation extends that same proven logic. We're not taxing innovation. We're incentivizing companies to invest in the workforce that makes innovation possible.
Chapter 30: The Global Response — What Governments Are Doing (and Not Doing)
The Global Policy Gap
Finding: As of March 2026, no country has implemented a comprehensive, successful government-funded automation transition program at the scale AI will require. What exists globally is a patchwork of sectoral programs, time-limited aid, and emerging frameworks—but every major economy except the United States is at least trying.
- Sectoral programs: Germany's coal transition ($44B over 25 years; 20K workers = $2.2M per worker)
- Time-limited aid: US Trade Adjustment Assistance ($10K–$15K per worker; outcomes mediocre)
- Comprehensive workforce development: EU's Just Transition Mechanism (€55B for 2021–2027), deployed through three pillars: €17.5B in grants to coal regions (Territorial Just Transition Plans), €1.8B in guarantees for private investment (through EIB), and €10B in public sector loans for infrastructure. Results to date: mixed—only 30% of funds deployed by 2024. Poland (largest recipient) still struggling with coal transition despite €11B JTF support for 150K workers. Also: SkillsFuture in Singapore ($500M/year for retraining)
- UBI pilots: Finland ($560/month for 2K workers; no employment impact); Kenya ($22/month for 12K workers; better entrepreneurship outcomes)
- Industrial workforce strategy: China's AI Plus initiative ($125B/year with integrated workforce planning)
What's Working: Germany's Coal Transition
Context: Germany phased out coal energy (2020–2038 timeline), directly displacing 20,000 coal miners and 28,000 ancillary workers in energy-dependent regions (Brandenburg, Ruhr Valley, Saarland).
Program: €260 billion over 25 years, structured as:
- Early retirement: Coal miners could retire 10 years early with government-funded pensions (€60K–€75K/year)
- Wage insurance: Workers transitioning to new jobs received 70% wage replacement for 2 years, then 50% for 3 years (soft-landing approach)
- Retraining: Government-funded apprenticeships in renewable energy, digital skills, industrial modernization
- Regional development: €40B directed to coal regions for infrastructure, research hubs (hydrogen centers), business incubation
Outcomes (to date, 2023–2026):
- 85% of coal workers reemployed by 2023, though with 15% average wage loss
- 75% remaining in home region (prevented mass outmigration of working-age population)
- New renewable energy sector created ~25,000 jobs in coal regions by 2025
- Cost per successfully transitioned worker: ~€1.3 million (25-year cumulative)
Key lessons: Generous, long-term funding works. Worker choice (early retirement vs. retraining) increases satisfaction. Regional economic diversification prevents community collapse. But cost is prohibitive for large-scale displacement ($1.3M per worker × 4.2M workers = $5.5 trillion—far beyond any government's capacity).
What's Emerging: Singapore SkillsFuture (Gold Standard)
Most successful model globally. Mandatory levy (0.25% of payroll) + equal government match = $1B/year for worker retraining. Workers choose training from approved list. 50%+ of workforce participated (2015–2024). 70% of retrainees found new jobs; 60% at equal or higher wages. Cost per worker: ~$750/year.
Why it works: Tripartite governance (government, employers, unions), worker choice, employer buy-in, continuous model (not emergency response). Treats workforce development as infrastructure investment, not welfare spending—a framing that resonates across the political spectrum.
What's Failing: Robot Taxes and UBI
Robot taxes: South Korea proposed (2021) a 5–10% tax on automation investment. Industry opposition was fierce. Proposal was dropped. No country has successfully implemented an automation tax. Why: implementation difficulty, competitiveness concerns, philosophical opposition.
UBI experiments: Finland tested €560/month for 2,000 unemployed workers. No employment boost; well-being improved but job transition success was no better than control group. Insufficient at scale and doesn't solve skills mismatch.
The Policy Gap: What Separates Success from Failure
| Factor | Successful Programs | Failed Programs |
|---|---|---|
| Funding per worker | €400K–€1.3M (multi-year) | $10K–$50K (insufficient) |
| Duration | 5–25 years commitment | 12–36 months (time-limited) |
| Worker choice | Voluntary options (early retirement, retraining, wage insurance) | Mandated retraining only |
| Employer engagement | Employer involvement in training design; apprenticeship models | Top-down government programs |
| Private sector management | Fund management by professionals (pension fund, SBIC models) | Political appointees controlling investments |
| Success rates | 75–90% employment (12+ months) | 50–65% employment (6+ months) |
Key Insight: Proactive Investment Beats Reactive Crisis Management
Proactive transition investment (training, relocation, income support during transition): $100K–$300K per worker.
Reactive crisis response (unemployment insurance, social services, health costs): $120K–$150K per worker.
Plus: Lost tax revenue, community collapse, social instability costs estimated at $50K–$100K per worker in reactive scenario.
Conclusion: Proactive investment is cheaper, more humane, and more effective. The GI Bill proved this in 1944. Singapore proves it today.
Chapter 31: Why Robot Taxes Failed — And Why This Proposal Won't
The Robot Tax Fantasy
Automation taxes are theoretically appealing and politically toxic in practice. The logic is simple: tax companies for replacing workers with robots; use revenue to fund worker transition. No country has succeeded in implementing one. Here's why—and why the AI Workforce Investment Obligation is fundamentally different.
The Five Reasons Robot Taxes Failed
1. Implementation difficulty: How do you define a "robot" or "automation" for tax purposes? A spreadsheet macro? RPA software? Industrial robots? AI models? The boundary is impossible to draw without massive litigation.
2. Evasion and arbitrage: Without global coordination, companies relocate to tax-free jurisdictions.
3. Competitiveness fears (real and exaggerated): Companies claim automation tax makes them uncompetitive. This claim is overstated but politically powerful.
4. Philosophical opposition: Robot taxes are easy to caricature as anti-innovation. Both conservative and progressive politicians who support technology find them internally contradictory.
5. Enforcement complexity: Verifying automation claims requires deep audit of company operations. Administrative burden exceeds tax collection.
Why the AI Workforce Investment Obligation Is Different
The Alvelda Framework (Chapter 32) proposes a fundamentally different structure: an investment obligation with a tax penalty for non-compliance. Companies choose: invest in workforce transition (and receive a 50% tax credit), or pay a 25% assessment on wage-cost savings from documented job elimination.
| Dimension | Robot Tax (Failed) | AI Workforce Investment Obligation (Proposed) |
|---|---|---|
| Primary mechanism | Tax on automation investment | Investment in workforce transition funds (tax is penalty for non-investment) |
| Tax base | Automation equipment (hard to define) | Documented wage-cost reduction from eliminated positions (auditable) |
| Company incentive | Avoid automation → lose productivity | Invest in transition → get 50% tax credit + brand benefit |
| Philosophical frame | "Tax on innovation" | "Investment in the workforce that makes innovation possible" |
| Fund management | Government bureaucracy | Private sector-managed funds with public oversight (SBIC model) |
| Political positioning | Anti-business | Pro-worker AND pro-business (capitalism with transition responsibility) |
The critical reframe: We're not taxing innovation. We're incentivizing companies to invest in the workforce that makes innovation possible. The investment path is the primary path. The tax is the penalty for companies that take the productivity gains and walk away from the workers who created those gains. Companies that invest get a 50% tax credit, brand recognition as "responsible AI leaders," and a trained workforce pipeline. Companies that don't invest pay 25% of their wage savings—and they deserve to, because they're externalizing costs that taxpayers would otherwise bear.
Seven Structural Advantages of the Wage-Cost Savings Approach
The AI Workforce Investment Obligation succeeds where robot taxes failed because of seven structural advantages that make it verifiable, enforceable, and politically defensible:
- Verifiable base: Wage data is IRS-reportable and auditable. Labor board records show position eliminations. No need to classify or define "robot." Just: did you eliminate this job? What was the wage? The obligation is 25% of the wage-cost savings from that elimination. Simple.
- Causation requirement with safe harbor: The obligation only applies to documented job eliminations tied to AI/automation deployment. This creates an incentive for companies to be transparent about displacement through a safe harbor provision: companies that proactively disclose AI-driven workforce changes and invest in transition receive reduced regulatory scrutiny and streamlined compliance.
- "Responsible externality cost" framing: Companies that save money by cutting jobs are asked to contribute to transition costs for those workers. This is analogous to environmental cleanup requirements (companies that pollute pay for cleanup) and worker safety requirements. Philosophically defensible across the political spectrum.
- Affordable for companies: 25% of wage-cost savings means companies keep 75% of the productivity gain. With the 50% tax credit for QAITF investment, the effective cost is just 12.5% of wage savings. A 75–87.5% annual ROI is compelling; companies still automate aggressively while contributing to transition costs.
- Self-limiting and proportional: The rate is directly proportional to displacement magnitude. Massive automation = larger obligation, but also massive cost savings for the company (which can afford the larger contribution). Small automation = small obligation. Auto-calibrates.
- Hard to evade: Companies can't avoid the obligation by hiding wage savings. If they're automating U.S. jobs, they're saving wages. Authorities can verify via payroll records, labor board filings, and SEC disclosures. Publicly traded companies report headcount and wage expenses in quarterly filings—creating an independent verification mechanism that makes evasion detectable through routine financial analysis. No clean escape route unlike robot taxes.
- Building block, not ceiling: If the wage-cost approach proves effective, it can be expanded to other automation (not just AI). The framework is generalizable.
Chapter 32: The Alvelda AI Workforce Investment Framework
Core Innovation: Invest OR Pay — The GI Bill for the AI Age
Central principle: Companies conducting AI-driven workforce transitions are given a clear choice: Invest in Qualified AI Transition Funds (QAITFs) and receive a 50% tax credit, OR pay a 25% assessment on wage-cost savings. The investment path is the primary, preferred path. The assessment is the penalty for companies that choose not to invest in the workforce transition they're creating.
This is capitalism with transition responsibility—not government-directed investment. It follows the same logic as the GI Bill (invest in people during transition, reap outsized economic returns), the CHIPS Act (condition industrial benefits on workforce development), and environmental cleanup requirements (companies that create externalities must address them).
The Investment Path (Primary Mechanism)
- Trigger: Company eliminates ≥100 jobs due to AI/automation OR ≥5% of workforce in a single year
- Investment obligation: Invest 25% of wage-cost savings from those eliminations into a government-approved Qualified AI Transition Fund (QAITF)
- Tax credit: Company receives 50% tax credit for QAITF investments—effectively reducing net cost to 12.5% of wage savings vs. 25% for the straight assessment
- Fund choice: Company selects from approved QAITFs in the state where jobs were eliminated (50 state funds, not one federal bureaucracy)
- Sunset: Obligation expires 3 years after job elimination (or when worker successfully transitions to comparable-wage employment, whichever is sooner)
The Assessment Path (Penalty for Non-Investment)
- Companies that choose not to invest in QAITFs pay a 25% assessment on wage-cost savings, assessed annually for 3 years
- No tax credit for the assessment path
- Assessment revenue flows to state-level transition funds
- This path costs companies 2x more than the investment path (25% vs. effective 12.5%)—creating strong incentive to invest
The Framing That Matters
"We're not taxing innovation. We're incentivizing companies to invest in the workforce that makes innovation possible. Companies that invest get a 50% tax credit and a trained workforce pipeline. Companies that don't invest pay a modest assessment because they're shifting their transition costs to taxpayers. The choice is theirs."
Fund Structure: Private Sector-Managed, Public Oversight
QAITFs are structured as private sector-managed transition funds with public oversight—modeled on the Small Business Investment Company (SBIC) program, which has operated successfully since 1958 and funded companies including Apple, Intel, and Costco at zero net cost to taxpayers.
Decentralized Architecture: 50 State Funds
- 50 state-level QAITFs, each licensed by the state and approved at the federal level
- State funds address state-specific industry concentrations, workforce profiles, and transition needs
- No single federal fund—decentralization prevents political capture and enables local responsiveness
- Federal role limited to: setting minimum standards, approving fund managers, auditing outcomes, providing tax credit administration
Fund Governance
- Fund boards: Majority private sector and labor representation (minimum 60%), with public oversight members (maximum 40%)
- Board composition: 3 private sector leaders (including 1 from contributing companies), 2 labor/worker representatives, 2 public oversight members (state workforce agency + independent expert)
- No political appointees in fund management roles—professional fund managers selected through competitive process
- Performance metrics: Job creation rate, wage outcomes for transitioned workers, fund return on investment, community impact scores
QAITF Qualification Requirements
- Track record: Fund managers must demonstrate 5+ years of venture investment history with measurable job creation outcomes
- Governance: Independent board, annual audits, transparent reporting
- Portfolio requirements: Minimum 30% of investments in companies that hire displaced workers; minimum 20% in underserved geographic regions
- Performance standards: Must achieve minimum job creation thresholds per $1M invested within 3-year rolling windows
- Revocation: Funds that underperform lose QAITF status and tax-credit eligibility
Investment Portfolio
Each state QAITF invests across a diversified portfolio:
- 40% startup ecosystem ($20B nationally): Seed and early-stage companies creating jobs in the state. 40K seed companies → 160K jobs created (30K sustainable after 5 years)
- 30% workforce retraining ($15B): Community college partnerships, apprenticeship programs, AI skills certifications, wage insurance during transition
- 20% growth-stage companies ($10B): Scaling companies with high job-creation potential. 833 companies → 35K jobs (25K sustainable)
- 10% community development ($5B): Infrastructure for transition communities—broadband, childcare, transportation, healthcare access
Economic Analysis
Jobs created: 165K direct + 124K indirect = 289K total (multiplier ~5.5 jobs per $1M invested)
Cost per transitioning worker: $52B ÷ 4.2M workers = $12.4K per worker (plus state funding, philanthropic partnership, and direct retraining investment)
vs. cost of inaction: $123K per worker (unemployment insurance, social services, public health, community decline)
Net savings to government: $110K per worker = $463B for 4.2M workers
GI Bill comparison: The original GI Bill invested $175B (inflation-adjusted) in 7.8 million veterans and generated $6–$7 in tax revenue for every $1 invested. A $52B investment in AI workforce transition, producing even half that return ratio, would generate $150–$180B in economic value—while preventing $463B in crisis costs.
Wage Outcomes
Startup jobs created: Average $58K (vs. $54K baseline for transitioning workers)
Retraining jobs (community college partner): Average $48K (12% wage decline)
Blended outcome (mixed portfolio): 60% of workers successfully transition; average wage outcomes: -2% (vs. -18% in offshoring wave without intervention)
Why This Structure Appeals Across the Political Spectrum
| Political Perspective | Why This Works |
|---|---|
| Fiscal Conservative | Self-funding (no new taxpayer money). Private sector-managed. Tax credit incentivizes investment. Saves government $463B in crisis costs. SBIC model with 60-year track record. |
| Pro-Business | Companies keep 75–87.5% of productivity gains. Investment path creates trained workforce pipeline. Brand benefit as "responsible AI leader." No bureaucratic mandates on how to automate. |
| Labor/Progressive | Workers get transition support, retraining, wage insurance. Companies can't externalize transition costs. Labor representation on fund boards. Multi-track options (worker choice). |
| National Security | Preserves human capital for defense industrial base. Maintains community stability. Prevents the social instability that hostile actors exploit. Feeds CHIPS Act workforce pipeline. |
| Libertarian | Corrects market failure (externalized costs). Decentralized (50 state funds, not federal). Private management, not government bureaucracy. Companies choose their path. |
Chapter 32B: Bridging Parts III and IV — Healthcare and AI Workforce Transition
The Two Biggest Threats to American Competitiveness
Part III of the Brainworks Policy Series documented the $1.2 trillion healthcare extraction machine—the administrative waste, monopoly pricing, and insurance bureaucracy that costs U.S. employers 3–10x more per worker than international competitors. Part IV addresses AI workforce displacement—4.2 million jobs in transition without a national strategy.
These are not separate problems. They are deeply interconnected, and solving one without addressing the other leaves American workers and businesses vulnerable.
Healthcare Costs Make AI Displacement MORE Damaging
In the United States—uniquely among developed nations—workers lose their health insurance when they lose their jobs. This transforms every AI-driven job loss into a dual crisis: loss of income AND loss of healthcare access. No other major economy imposes this double burden on displaced workers.
- COBRA costs: Displaced workers can continue employer coverage through COBRA, but must pay the full premium ($25,572/year for family coverage in 2025)—obviously unaffordable for someone who just lost their job
- ACA marketplace: Available but with enrollment periods, complexity, and cost-sharing that create gaps in coverage
- Medicaid: In the 10 states that have not expanded Medicaid, working-age adults without children may have no coverage option at all
- Medical debt cascade: 100 million Americans already owe medical debt. Displaced workers who defer treatment face worsening conditions, medical bankruptcy, and destroyed credit—which blocks access to mortgages, business loans, and even employment
The healthcare-displacement multiplier: In countries with universal healthcare (Germany, Canada, UK, Singapore, Japan), a displaced worker loses income but retains healthcare. The transition is painful but survivable. In the U.S., a displaced worker faces both income loss AND healthcare loss—creating cascading crises that make transition harder, longer, and more expensive to address.
Healthcare Costs Suppress the Entrepreneurship That Creates Replacement Jobs
The AI Workforce Investment Framework (Chapter 32) depends partly on startup job creation to absorb transitioning workers. But U.S. healthcare costs suppress entrepreneurship—the very engine needed for transition:
- "Job lock": Economist Brigitte Madrian estimated that healthcare-linked job lock reduces voluntary job mobility by 25%. Workers who might start businesses stay in corporate jobs for the insurance
- Denmark paradox: Denmark, with universal healthcare, has higher entrepreneurship rates than the United States despite higher taxes
- Small business burden: Small businesses pay 8–18% more per employee for health coverage than large firms, creating a structural disadvantage for the startups that drive job creation
- Medical bankruptcy: ~550,000 Americans file for bankruptcy annually due to medical bills. Aspiring entrepreneurs with medical debt on their credit reports cannot access startup capital
The Integrated Solution
Parts III and IV together address the two biggest threats to American competitiveness:
| Problem | Part III Solution | Part IV Solution | Combined Effect |
|---|---|---|---|
| Employer healthcare burden ($15K+/worker) | Administrative simplification, transparency, competition | Healthcare continuation in transition | Employers freed to invest in AI AND workers |
| Healthcare loss during displacement | Universal coverage models | QAITF-funded healthcare bridge | Workers can transition without healthcare fear |
| Entrepreneurship suppression | Decouple insurance from employment | Startup ecosystem investment | Displaced workers become entrepreneurs, not dependents |
| Community collapse | Rural hospital preservation | Community transition investment | Communities remain viable during transition |
The Bottom Line
Universal healthcare removes healthcare anxiety from workforce transition. AI Workforce Investment creates the jobs and skills for the next economy. Together, they address the two structural weaknesses that most threaten American competitiveness—and they reinforce each other. A worker who knows they won't lose their healthcare is a worker who can take the risk of retraining, relocating, or starting a business. A healthcare system freed from employer-based administration has $1.2 trillion in liberated capital to invest in innovation. Parts III and IV are not separate policy proposals—they are two halves of a comprehensive American competitiveness strategy.
Chapter 33: The Legal Fortress — Constitutional Defense and ERISA
Key legal questions addressed:
- Is a wage-cost savings assessment constitutional? (Yes; well-established authority to tax economic activities and to condition tax benefits on investment behavior—the same basis as R&D tax credits, Opportunity Zone incentives, and CHIPS Act provisions)
- Does the QAITF investment/tax credit structure survive scrutiny? (Yes; analogous to SBIC program, Opportunity Zone Qualified Opportunity Funds, and 401(k) employer matching requirements)
- Does it violate ERISA? (No; applies to employer investment decisions, not pension/benefit plans)
- Takings Clause concerns? (No; standard business taxation, not a taking)
- Commerce Clause challenge? (Defended; similar to environmental regulation, worker safety rules, CHIPS Act conditions)
Strongest defense precedent: The CHIPS Act conditions $52.7 billion in government subsidies on workforce development plans—establishing that government can require workforce investment as a condition of economic benefit. The AI Workforce Investment Obligation extends the same logic: companies receiving the economic benefit of AI automation must invest in workforce transition. The SBIC model (60+ years, zero net cost to taxpayers) demonstrates that public-private fund structures survive legal scrutiny.
Additional conservative legal precedent: Opportunity Zones (2017 Tax Cuts and Jobs Act, championed by Senators Tim Scott and Cory Booker) established that tax incentives can direct private capital to public policy goals. The QAITF tax credit structure mirrors this approach.
Litigation risk assessment: Medium (tech industry will challenge; likely to lose, but appeals process takes 5–7 years). Critical strategy: begin fund implementation immediately after passage. By the time litigation reaches final judgment, the program will have created constituencies (transitioned workers, funded startups, community investments) that make repeal politically impossible—the same dynamic that protected Social Security and Medicare.
Chapter 34: The 10-State Strategy — Reform-Ready States
State Selection: Economic Impact, Not Political Alignment
The v1.0 strategy focused on three deep-blue states (California, Washington, New York). The v2.0 strategy expands to 10 reform-ready states selected by economic impact, industry concentration, existing infrastructure, and bipartisan potential—not political alignment. Critically, the inclusion of red and purple states (Texas, Ohio, Georgia, Arizona) provides the bipartisan credibility that federal legislation requires.
| Rank | State | Workers in Transition | Governance | Phase 1 Probability | Strategic Value |
|---|---|---|---|---|---|
| 1 | Massachusetts | 195,000 | Dem supermajority | 80% | Chapter 58 precedent; Healey AI Hub |
| 2 | Washington | 215,000 | Dem supermajority | 75% | Cascade Care model; tech concentration |
| 3 | California | 680,000 | Dem supermajority | 75% | Largest impact; national precedent |
| 4 | Colorado | 155,000 | Dem supermajority | 70% | SB 24-205 AI Act precedent; Polis |
| 5 | New York | 420,000 | Dem trifecta | 55% | Finance sector; 2nd largest impact |
| 6 | Ohio | 185,000 | GOP supermajority | 55% | Manufacturing transition; bipartisan cred |
| 7 | Oregon | 110,000 | Dem trifecta | 55% | Tech (Portland); progressive legislature |
| 8 | Arizona | 140,000 | Split (D gov, R leg) | 50% | CHIPS Act fabs; semiconductor workforce |
| 9 | Georgia | 170,000 | GOP supermajority | 45% | Emerging tech hub; swing state |
| 10 | Texas | 385,000 | GOP supermajority | 20% | 3rd largest impact; bipartisan essential |
| 10-State Total | 2,655,000 | 63% of national displacement |
Why Red States Matter
Including Texas (385K workers, GOP governance), Ohio (185K, GOP supermajority), and Georgia (170K, GOP supermajority) is not political tokenism—it's strategic necessity. Federal legislation requires bipartisan support. State-level success in red states proves the framework isn't "liberal policy in disguise." And the workers in these states face the same transition challenges regardless of their governor's party. AI doesn't check voter registration.
Chapter 35: State-by-State Profiles and Legislative Roadmaps
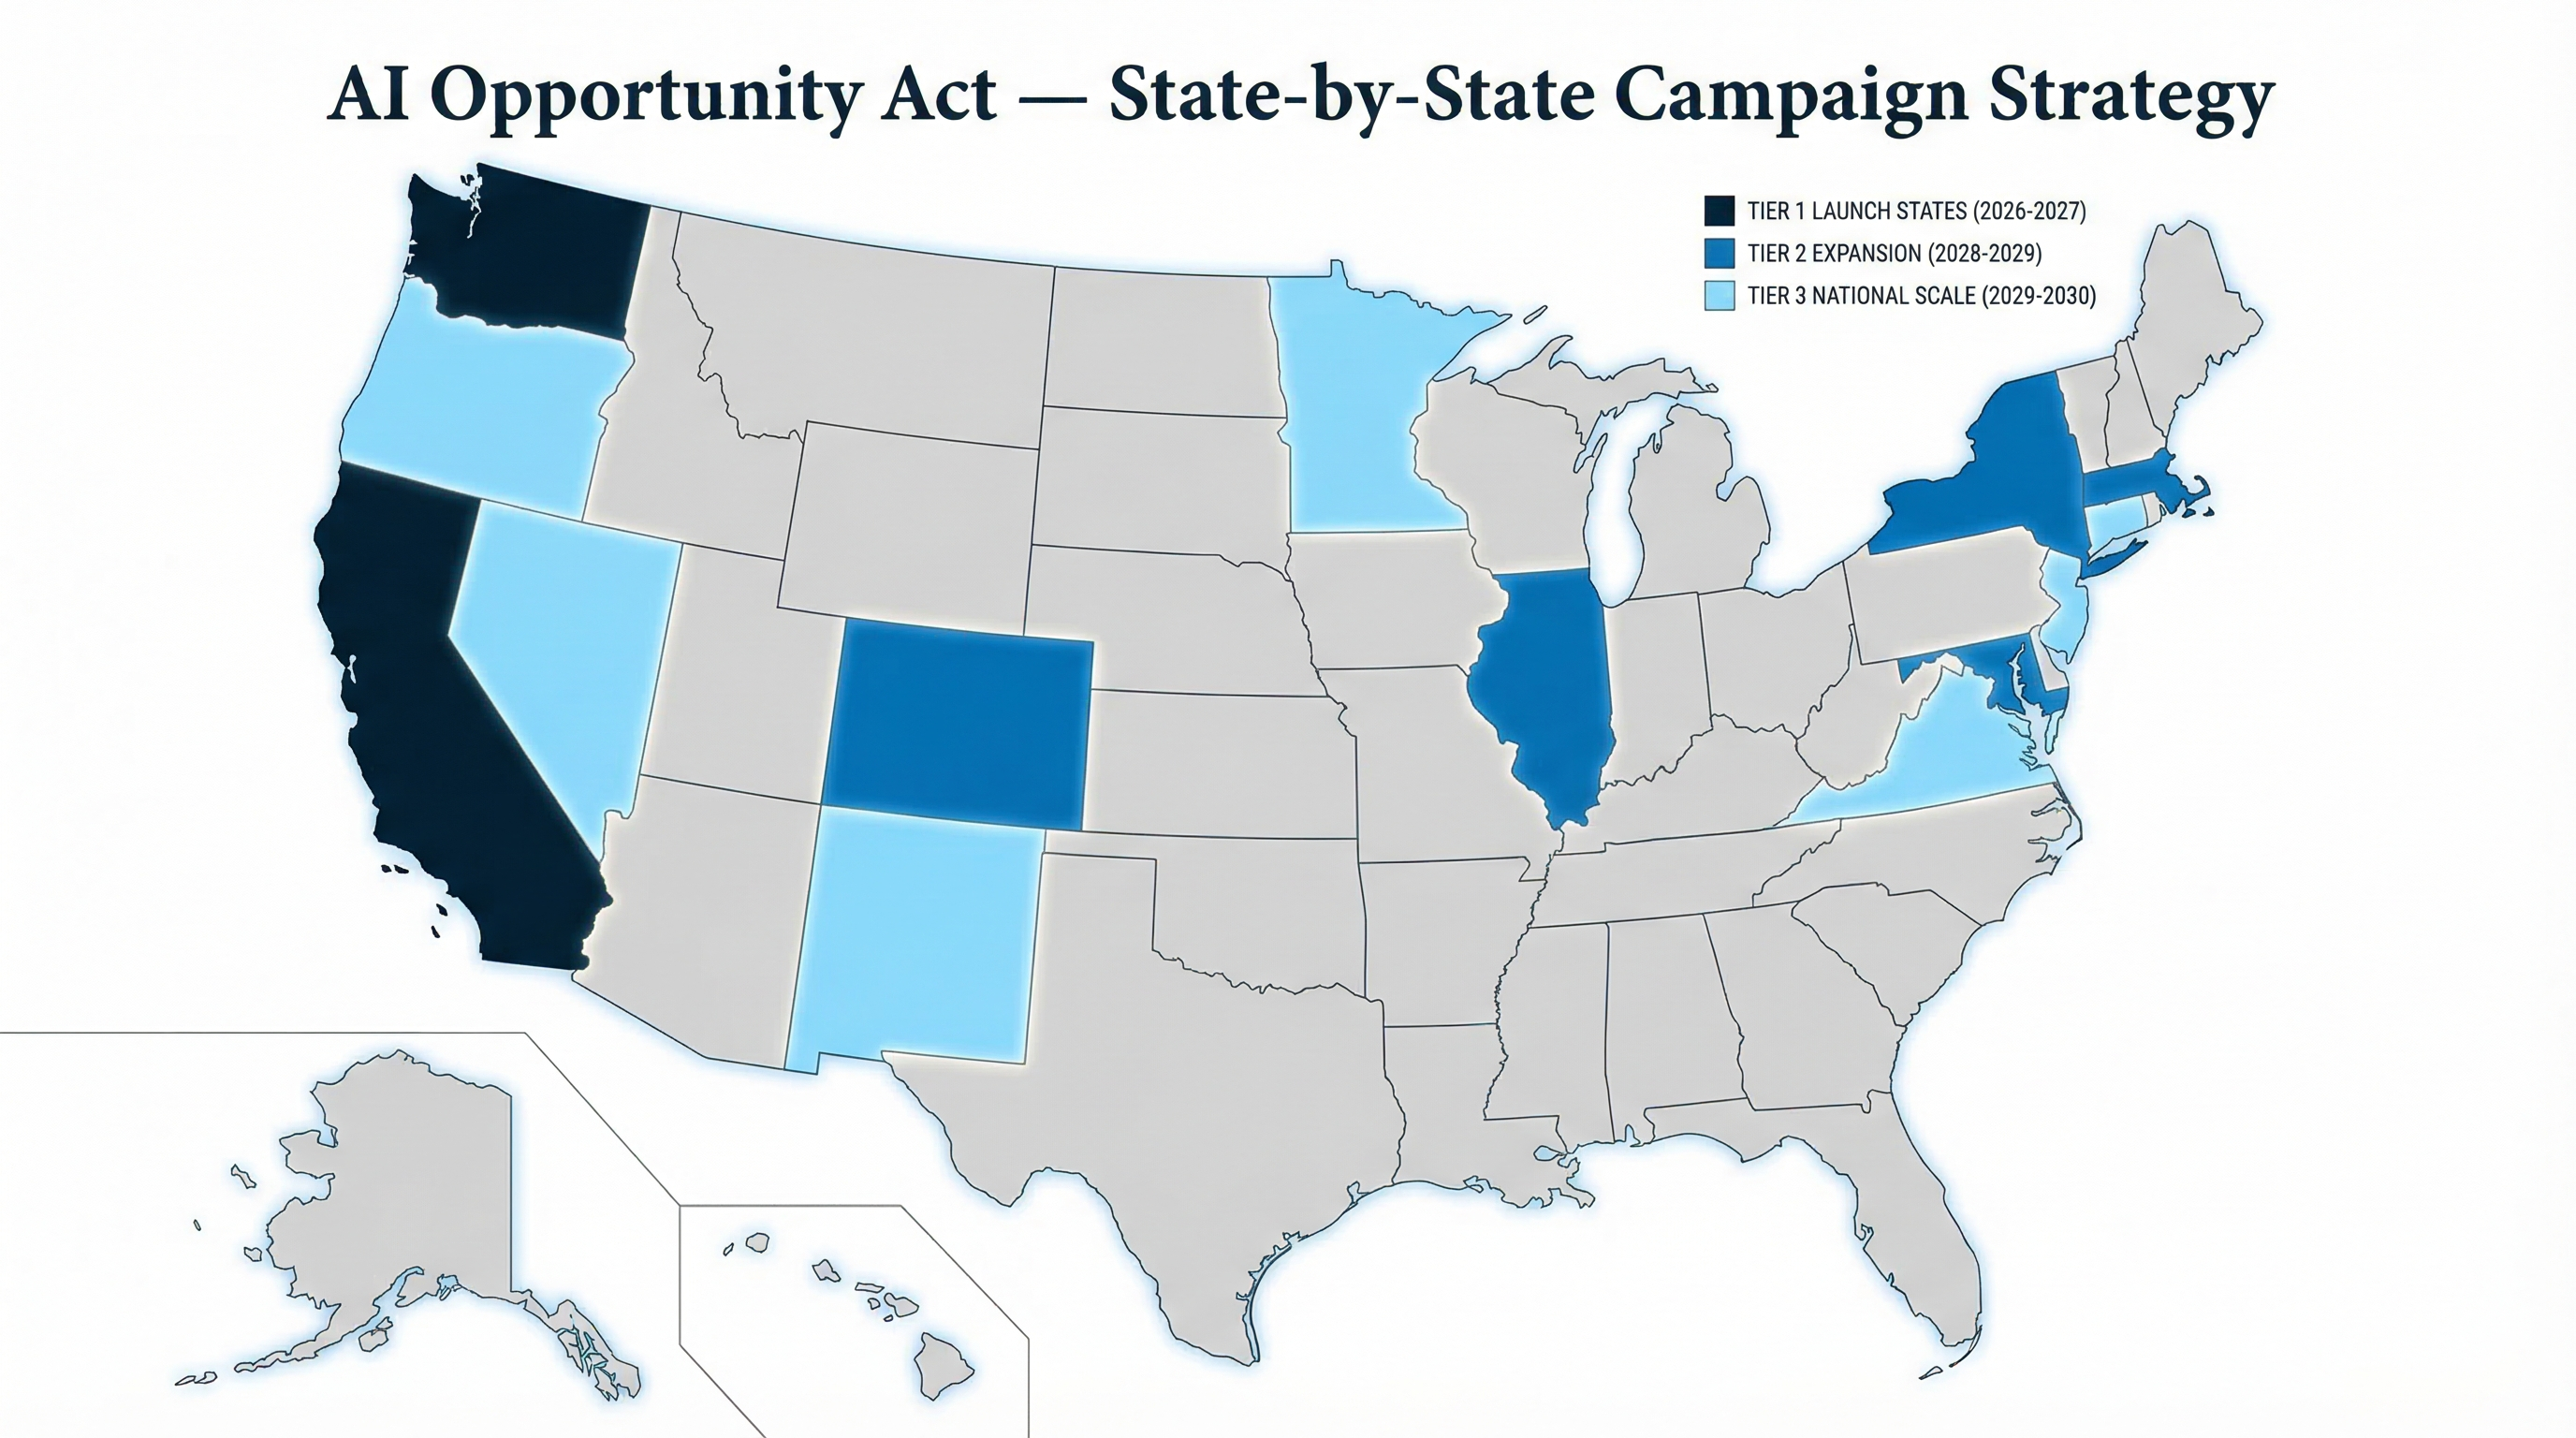
Tier 1 States: High-Probability Early Movers (2026–2027)
🔵 MASSACHUSETTS — "Massachusetts Healthcare & AI Opportunity Act"
Workers in transition: 195,000 | Phase 1 probability: 80% | Governor: Maura Healey (D)
Why Massachusetts leads: Healey launched AI Hub initiative (December 2024) and rolled out ChatGPT-powered assistant to 40K state workers. Chapter 58 (2006 healthcare reform) demonstrates willingness to legislate comprehensively. Democratic supermajority + progressive legislature. Sweeping 2025 healthcare market oversight bill shows regulatory appetite.
Framing: "Building on Chapter 58: Healthcare Security for the AI Age." Extension of Massachusetts' healthcare leadership legacy into workforce transition.
Coalition: Massachusetts AFL-CIO, SEIU Local 509, Nurses union (MNA), Harvard/MIT faculty, tech companies (Google, Microsoft, Meta presence), Healey administration.
Timeline: Phase 1 legislation introduced Q1 2026. Advance notice requirements (120 days) + healthcare continuation guarantee + reskilling fund. Phase 2 (2027–2028): AI Workforce Development Fund.
🔵 WASHINGTON — "Washington AI Transition & Healthcare Security Act"
Workers in transition: 215,000 | Phase 1 probability: 75% | Governor: Bob Ferguson (D)
Why Washington: Cascade Care public option fully implemented statewide 2025—proven healthcare model. Ferguson (newly elected) has healthcare as priority issue. Highest tech concentration outside California. Strong labor tradition (SEIU, Amazon worker organizing). B&O tax infrastructure already taxes business activity.
Framing: "Cascade Care Plus: Extending Healthcare Security to AI Transition." Builds on public option success narrative.
Coalition: Washington State Labor Council, SEIU Local 775 (45K members), tech worker organizing (Amazon Employees, Alphabet Workers Union), Ferguson administration.
Timeline: Phase 1 Q2 2026. Integrated with Cascade Care—displaced workers auto-qualify for public option. Phase 2 (2027–2028): Single-payer foundation.
Revenue opportunity: Leverage B&O tax infrastructure (already taxes business activity). No state income tax makes automation tax politically viable. Tax opportunity: $2–3B over 11 years.
🔵 CALIFORNIA — "California AI Opportunity Act"
Workers in transition: 680,000 | Phase 1 probability: 75% | Governor: Gavin Newsom (D)
Why California: Largest single-state impact. Democratic supermajority. Tech industry HQs concentrated. AB 5 precedent (2019) shows CA passes controversial worker protection despite business opposition. SB 947 and SB 951 (AI employment bills) already in legislative pipeline.
Framing: "California workers built the tech industry—let's make sure they benefit from it." AI as opportunity with accountability.
Coalition: California Labor Federation, SEIU Local 1000, CNA/NUHW, UC Berkeley/Stanford AI research, forward-thinking tech leaders.
Timeline: Phase 1 (2026–2027): AI Workforce Transparency + advance notice requirements. Phase 2 (2027–2030): Investment obligation + Qualified California AI Enterprise Funds. Fund size at scale: $2–4B annually.
Detailed 4-Phase California Legislative Sequence (2025–2032)
Phase 1 (2025–2027): AI Workforce Transparency Act
- Require companies with 50+ CA employees to report AI-driven layoffs
- Create public dashboard showing displacement data
- Establish advisory board + 3 regional pilot programs
- Cost: $25M (no new tax; from existing budgets)
- Political difficulty: LOW (transparency hard to oppose)
Phase 2 (2027–2030): AI Workforce Investment Act
- Companies conducting large AI layoffs must: (A) pay 25% tax on wage-cost savings OR (B) invest in Qualified California AI Enterprise Funds (QCAEFs)
- Fund size: $2–4B annually at scale
- Jobs created: 50K–100K annually by 2032
- Political difficulty: MEDIUM-HIGH (powerful tech opposition expected; but Phase 1 data supports case)
Phase 3–4 (2030–2035): Regional AI enterprise zones, sector-specific development, extension to all automation
Political path to Phase 1 passage (2025–2026):
- January–February 2026: Introduce AB XXXX
- March–May 2026: Committee hearings
- May–June 2026: Assembly floor vote + passage
- July–September 2026: Senate vote + passage
- October 2026: Governor signature (likely; Newsom supportive)
- January 2027: Effective date
Opposition: Tech industry (Google, Meta, Apple lobbying), venture capital (NVCA), Chamber of Commerce, conservative Republicans
Passage probabilities: 65–75% Phase 1 (transparency hard to oppose); 40–55% Phase 2 (costs companies money, but Phase 1 data makes the case). AB 5 precedent (2019) demonstrates California's willingness to pass controversial worker protection legislation despite intense tech industry opposition.
🔵 COLORADO — "Colorado Responsible AI Transition Act"
Workers in transition: 155,000 | Phase 1 probability: 70% | Governor: Jared Polis (D)
Why Colorado: Already passed SB 24-205 (Colorado AI Act, 2024)—nation-leading AI regulation. Polis is a tech entrepreneur who supports both innovation and worker protection. Colorado Option public option producing $493M+ in premium savings. Democratic supermajority.
Framing: "Completing Colorado's AI framework." SB 205 was consumer/bias-focused; this adds worker protection. "Responsible AI = Sustainable Growth."
Coalition: Colorado AFL-CIO, SEIU Colorado, Polis administration, Google/Microsoft (engaged on worker policy), Colorado Healthcare Institute.
Timeline: Phase 1 Q1 2026 as companion to SB 205 implementation. Phase 2 (2027–2028): Colorado Option Plus (auto-enrollment for displaced workers).
Tier 2 States: Moderate Probability (2026–2028)
🟣 NEW YORK — "New York Fair AI Transition Act"
Workers in transition: 420,000 | Phase 1 probability: 55% | Governor: Kathy Hochul (D)
Why New York: Second-largest state impact. Finance sector concentration (95K jobs in finance alone). Strong union base (DC37, UFT, 1199 SEIU). NY Health Act has 90+ Assembly sponsors showing legislative appetite. Wall Street dynamics create unique challenge and opportunity.
Framing: "AI worker protection as compromise"—gives workers protections while avoiding full healthcare system disruption. Bridge between single-payer advocates and fiscal moderates.
Challenge: Hochul's centrist positioning + $16B budget deficit. Senate Republicans historically blocking. Phase 1 (no new tax) should pass; Phase 2 harder. Phase 2 requires 32+ Senate votes (currently have ~23 solid)—a significant gap that requires sustained coalition building.
Timeline: Phase 1 (2026–2027): 90-day notice + healthcare continuation. Phase 2 (2027–2028): Public option expansion for displaced workers.
🔴 OHIO — "Ohio Workforce Resilience Act"
Workers in transition: 185,000 | Phase 1 probability: 55% | Governor: Mike DeWine (R)
Why Ohio: Manufacturing transition experience (Rust Belt). DeWine is a pragmatic conservative (unlike Abbott/DeSantis). Kasich expanded Medicaid in 2014—Ohio has bipartisan precedent. Strong union tradition (UAW, USW, AFSCME). Columbus is a growing tech hub (LinkedIn, Google, startups).
Framing: "Ohio Pragmatism: Protect Workers, Maintain Competitiveness." Emphasizes adaptation, not restriction. "Ohio workers have adapted before—from steam to electricity, from manual to CNC, from analog to digital. They'll adapt to AI too, but they need the tools."
Coalition: Ohio Hospital Association, UAW, AFSCME, community colleges, moderate Republicans concerned about rural hospital closures, Ohio Farm Bureau.
Taboo: "coastal," "progressive," "disruption," "transformation." Power words: "community," "our hospitals," "our jobs," "practical," "common sense."
Timeline: Phase 1 (2026–2027): Workforce Resilience Pilot targeting Columbus/Cleveland tech workers. Phase 2 (2027–2028): Medicaid expansion stabilization.
🟣 ARIZONA — "Arizona AI Readiness Act"
Workers in transition: 140,000 | Phase 1 probability: 50% | Governor: Katie Hobbs (D)
Why Arizona: CHIPS Act semiconductor fabs (Intel, TSMC) create workforce development urgency. Split government (D governor, R legislature) creates negotiation dynamic. Medicaid expansion via Proposition 204 (2014) was bipartisan. Large retiree population with healthcare interests. Growing tech presence (Apple, Intel, Microsoft in Phoenix).
Framing: "Arizona AI Readiness"—military and practical connotations. "Arizona's economy is diversifying rapidly with major semiconductor, defense, and tech investments. AI is the next wave—Arizona should ride it." Emphasizes choice, freedom, Arizona solutions.
Taboo: "mandate," "federal," "California model," "regulation." Power words: "choice," "freedom," "independence," "Arizona solutions."
Timeline: Phase 1 (2026–2027): Education/reskilling focus, healthcare continuation guarantee. Phase 2 (2027–2028): Medicaid stabilization if federal cuts loom.
Tier 3 States: Lower Probability but Strategic (2027–2029)
🔴 GEORGIA — "Peach State Innovation Act"
Workers in transition: 170,000 | Phase 1 probability: 45% | Governor: Brian Kemp (R)
Why Georgia: Emerging tech hub (Atlanta). Georgia Tech AI research leadership. Bipartisan Medicaid opening (four GOP legislators co-sponsored expansion bill, January 2025—unprecedented). Rural hospital crisis forcing recalculation. Swing state dynamics. HBCUs (Morehouse, Spelman, Clark Atlanta) as workforce development partners.
Framing: "Peach State Innovation"—evokes pride and identity. "Georgia is already an AI leader through Georgia Tech. This ensures AI benefits flow to all Georgians." Connects to business-friendly identity (#1 state for business). Frames workforce investment as economic development.
Coalition: Metro Atlanta Chamber of Commerce, Georgia Hospital Association, HBCUs, Georgia Tech, faith communities (Black churches + rural white churches), Georgia Farm Bureau.
Timeline: Phase 1 (2026–2027): Expanded Pathways model + AI workforce training partnerships with community colleges and HBCUs. Phase 2 (2027–2028): Results-based expansion.
🔵 OREGON — "Oregon AI Worker Opportunity Act"
Workers in transition: 110,000 | Phase 1 probability: 55% | Governor: Tina Kotek (D)
Why Oregon: Portland tech ecosystem (Intel, Nike tech, startups). Democratic trifecta. Progressive legislature. Strong environmental justice/worker protection tradition. Marijuana legalization precedent shows Oregon's willingness to lead on state-level reform.
Framing: "Oregon leads on responsible innovation." Environmental justice + worker protection intersection.
Timeline: Phase 1 (2027): Advance notice + transition support. Follows CA/WA/CO lead with Oregon-specific adaptations.
🔴 TEXAS — "Texas AI Workers First Act"
Workers in transition: 385,000 | Phase 1 probability: 20% | Governor: Greg Abbott (R)
Why Texas (despite low probability): Third-largest state impact. If Texas passes any version, it transforms the national conversation—proving this isn't a blue-state issue. Massive tech presence (Austin, Dallas, Houston). Rural hospital crisis creating bipartisan healthcare opening. Post-Abbott era (2027 election) may create new possibilities.
Framing: "Texas Workers First"—"Texas" comes first. "Out-of-state tech companies shouldn't be able to automate Texas jobs without investing in Texas workers." Emphasizes free market, competition, local control. No regulation—employer-led transition with tax credits and community college partnerships.
Taboo: "regulation," "government program," "mandate," "European model," "tax." Power words: "freedom," "choice," "competition," "Texas-led," "protecting Texans."
Coalition: Texas Hospital Association, Texas Farm Bureau, NFIB Texas, faith communities, veterans' organizations, rural hospital administrators.
Timeline: Phase 1 (2027–2028): Voluntary employer-led transition partnerships + retraining tax credits. Phase 2 depends on post-Abbott governance. Primary strategy: use Tier 1 state successes to build the case.
The State-to-Federal Cascade
Year 1 (2026): Massachusetts, Washington, California, Colorado pass Phase 1 (transparency + advance notice). Ohio, Arizona introduce Phase 1 bills.
Year 2 (2027): Phase 1 dashboards operational in 4+ states—real displacement data available. New York, Oregon pass Phase 1. Georgia introduces Peach State Innovation Act. 7–8 states with active legislation.
Year 3 (2028): Federal Phase 1 legislation introduced (bipartisan sponsors citing state data). Federal AI Workforce Transparency Act: $500M budget, establishing federal data collection, dashboard, and commission overseeing state pilots. Estimated passage probability: 65–75% (bipartisan). Phase 2 investment bills advance in CA, WA, MA. 10–15 states with transparency laws. Federal government faces choice: harmonize via federal framework OR deal with state patchwork.
Year 4 (2029–2030): Federal AI Workforce Investment Act passes (estimated 55–70% probability if state models demonstrate success). Federal framework becomes inevitable.
Chapter 36: Building the Bipartisan Coalition — From Labor Halls to the Chamber of Commerce
The v1.0 coalition strategy focused on progressive organizations. The v2.0 strategy builds a genuinely bipartisan coalition that includes conservative economic organizations, business groups, military/veteran organizations, and community institutions—because AI workforce transition is an economic reality, not a partisan cause.
Tier 1: Core Coalition Partners (Must-Have, 50+ Organizations)
Labor Coalition
- AFL-CIO (federation sponsor; 12.5M affiliated members)
- Service Employees International Union (SEIU—2.3M members, largest private sector union)
- Communications Workers of America (CWA—tech workers, 700K members)
- United Auto Workers (UAW—manufacturing displacement experience)
- United Steelworkers (manufacturing transition veterans)
- National Education Association + American Federation of Teachers (retraining infrastructure)
Business & Market Organizations
- National Association of Manufacturers (NAM)—automation transition expertise; represents 14,000 member companies. NAM's workforce development programs already address skills gaps; the QAITF framework extends their existing mission
- U.S. Chamber of Commerce—business credibility essential for bipartisan positioning. Healthcare cost burden ($15K+/worker) makes Chamber receptive to transition solutions that prevent crisis unemployment costs
- R Street Institute—center-right think tank focused on free-market solutions to governance challenges. Their workforce programs align with private-sector-managed QAITF structure
- Main Street Alliance (small business concerns)
- Community Development Financial Institutions Association
Conservative & National Security Organizations
- Heritage Foundation workforce programs—Heritage's workforce development initiatives focus on skills training and apprenticeships. The QAITF framework's private-sector management and tax credit structure aligns with Heritage's preference for market-based solutions
- American Enterprise Institute (AEI)—extensive research on market-based workforce transition. AEI's focus on human capital development and competitive labor markets supports the framework's economic logic
- Military/veteran organizations: American Legion, VFW, Iraq and Afghanistan Veterans of America. The "GI Bill for the AI Age" framing resonates directly. Veterans' organizations understand workforce transition and support investment in American workers
- Council for a Strong America / Mission: Readiness—retired military leaders focused on workforce readiness and population health. The 77% youth military ineligibility rate makes workforce investment a national security priority
Tier 2: Strategic Amplifiers (30+ Organizations)
- Community colleges (bipartisan)—American Association of Community Colleges represents 1,000+ institutions. Community colleges are the primary retraining infrastructure for displaced workers and have bipartisan support in every state
- Moderate Republican governors—DeWine (OH), Kemp (GA), Sununu (NH) have pragmatic approaches to workforce issues. Their endorsement transforms the coalition from progressive to genuinely bipartisan
- Tech leaders supporting responsible AI transition: Select executives from Microsoft (Brad Smith's responsible AI advocacy), Salesforce (Marc Benioff's stakeholder capitalism), and others willing to publicly support workforce investment
- Economic Policy Institute (progressive economics)
- Center for American Progress (policy infrastructure)
- Niskanen Center (libertarian-leaning center; universal catastrophic coverage advocate)
- Arnold Ventures (evidence-based bipartisan reform philanthropy)
Tier 3: Geographic & Sector Coalitions (50+ Organizations)
- State labor federations (all 10 target states)
- State hospital associations (rural hospital crisis creates bipartisan healthcare allies)
- State farm bureaus (rural community concerns)
- Faith community networks (both progressive urban and conservative rural—AI displacement is a moral issue)
- Historically Black Colleges and Universities (HBCUs—workforce development partners, especially in Georgia)
- Regional economic development councils
- Tech worker organizing groups (Amazon Employees, Alphabet Workers Union)
Fundraising Strategy: $107–$160M (2025–2030)
| Source | Amount | Notes |
|---|---|---|
| Labor unions | $40–50M | Foundation grants + member contributions |
| Progressive foundations | $25–35M | MacArthur, Ford, Mellon, Gates, Omidyar |
| Conservative/bipartisan foundations | $10–20M | Arnold Ventures, Koch (workforce focus), Walton |
| Tech company contributions | $15–25M | Responsible tech leaders (Microsoft, Salesforce, select founders) |
| Grassroots/member fundraising | $10–15M | Online campaigns, events, small-dollar |
| Academic/think tank (in-kind) | $7–15M | Research partnerships, policy analysis |
| Total | $107–160M |
Chapter 37: The Opposition Playbook — What They'll Say and How to Win
Reframed Counter-Messaging for Bipartisan Audience
1. "This Kills Innovation"
Their claim: Workforce investment obligations reduce capital available for R&D; slow innovation.
Our rebuttal: Companies keep 75–87.5% of automation savings. The investment path (with 50% tax credit) costs companies just 12.5% of wage savings—a modest contribution that creates a trained workforce pipeline. The CHIPS Act conditions $52.7 billion on workforce investment, and no one calls that "anti-innovation." Countries managing transition well get MORE innovation, not less—because workforce stability enables risk-taking and entrepreneurship.
2. "Companies Will Flee"
Their claim: Investment obligation makes US uncompetitive; companies relocate.
Our rebuttal: Network effects and talent concentration keep companies here. Apple, Google, and Meta have stayed in California despite the highest state taxes in the nation. More importantly: every major competitor (EU, China, Singapore) already has workforce transition requirements. The U.S. is the outlier for NOT having them. Companies can't flee to countries with no requirements—those countries don't exist among major economies.
3. "This Is Socialism / Government Overreach"
Our rebuttal: This is capitalism with transition responsibility. Funds are private sector-managed, not government bureaucracies. The SBIC model (Apple, Intel, Costco) has operated since 1958. Opportunity Zones were championed by Republican Senator Tim Scott. The CHIPS Act was bipartisan. The GI Bill returned $6–$7 for every $1 invested. We're extending proven American models, not importing foreign ones.
4. "The Numbers Are Speculative"
Our rebuttal: Based on McKinsey, WEF, OECD peer-reviewed research. Phase 1 transparency will provide actual data by 2027. But here's the real point: manufacturing offshoring projections in 2000 were considered speculative too—and they turned out to be underestimates. We lost 5.8 million manufacturing jobs because we waited for "more data." How many more workers do we need to lose before we act?
5. "Government Can't Manage Funds Efficiently"
Our rebuttal: Agreed—that's exactly why the funds are PRIVATE SECTOR-MANAGED with public oversight. Not government bureaucracies. Professional fund managers selected competitively. Fund boards with majority private sector representation. Performance metrics and public accountability. This is the SBIC model, not the DMV.
6. "We Need Tax Cuts, Not Investment Mandates"
Our rebuttal: This IS a tax cut—for companies that invest. The 50% tax credit for QAITF investments is one of the most generous business tax incentives proposed in a decade. Companies that invest in workforce transition get rewarded. Companies that externalize costs to taxpayers pay their fair share. That's market discipline, not government overreach.
7. "We Need Tax Cuts, Not Tax Increases"
Their claim: General tax burden is already high; don't add more.
Our rebuttal: This is not general taxation—it's a specific assessment on a specific benefit (wage-cost savings from AI-driven job elimination). It's funded by the beneficiaries (companies profiting from automation), not general taxpayers. The cost of inaction ($123K per displaced worker in unemployment, social services, and public health costs) exceeds the cost of intervention ($110K per worker). Proactive investment actually saves government money long-term.
8. "This Only Works If Federal" (Why Start at the State Level?)
Their claim: State-level programs create a patchwork; only federal coordination works.
Our rebuttal: States are laboratories of democracy—this is how America has always innovated in policy. Prove the concept at state level, build an evidence base, then expand nationally. Federal legislation is slower and harder to pass without state-level proof points. Federal waivers are not needed for Phase 1–2 programs. State action can proceed independently of federal action. By the time 15–20 states have transparency laws, federal harmonization becomes inevitable.
9. "Government Shouldn't Pick Winners and Losers"
Their claim: Government can't allocate capital effectively; it will pick political favorites instead of the best investments.
Our rebuttal: We completely agree—which is precisely why government doesn't pick winners under this framework. The entire QAITF structure is designed to prevent this. Government certifies qualified private venture funds based on track record and performance standards. Those private VCs—not politicians, not bureaucrats—decide which companies to invest in. This is the same model used by every state pension fund in America: government sets the rules, private managers deploy the capital. CalPERS doesn't pick stocks; it selects qualified fund managers. DARPA doesn't build technologies; it funds private contractors who do. This is how America has always invested—public framework, private execution. The market picks winners; government ensures the game is fair.
Four Campaign Themes for Four Audiences
- Competitiveness theme (for centrists, pro-business, national security): "America is the only major economy without an AI workforce strategy. China, the EU, and Singapore are investing. We're falling behind. The AI Workforce Investment Obligation puts America first—investing in our workers to maintain our competitive edge."
- Fairness theme (for progressives, labor): "Companies profiting from AI should invest in the workers making those profits possible. Shared responsibility = shared prosperity. Workers deserve transition support—not a pink slip and a COBRA bill."
- Conservative values theme (for fiscal conservatives, libertarians): "The cost of inaction ($123K per displaced worker) exceeds the cost of investment ($110K per worker). This saves taxpayer money. It corrects a market failure. It preserves human capital and community stability. And it's managed by the private sector, not Washington bureaucrats."
- Smart Investment theme (for all audiences): "This is America's next great investment—like the GI Bill that built the middle class, the Interstate Highway System that connected the economy, and the DARPA investments that created the internet. Every $1 of government-catalyzed technology investment has historically returned $5–$25 in economic value. The AI Workforce Investment Obligation extends America's most successful investment model to the workforce transition challenge. This isn't spending—it's investing, through the same private venture capital firms that built Silicon Valley."
Chapter 38: International Precedent — Germany, the EU, Singapore, and the Just Transition
Comparative Lessons
| Program | Country | Workers | Cost per Worker | Employment Success | Wage Outcome |
|---|---|---|---|---|---|
| Coal Transition | Germany | 48K | €1.3M (25yr) | 85% | -15% avg wage |
| TAA | US | 500K+ | $12K | 65% | -18% avg wage |
| SkillsFuture | Singapore | 1M+ | €750/yr | 70% | -7% avg wage |
| Just Transition Fund | EU | 160K direct | €340K | ~65% (in progress) | TBD |
| AI Plus Initiative | China | 5M+ (target) | ~$25K (est.) | In progress | In progress |
| CHIPS Act Workforce | US | ~100K (target) | ~$130K | In progress | In progress |
| GI Bill (original) | US | 7.8M veterans | ~$22K (adj.) | >90% | +35% lifetime |
| AI Workforce Investment (proposed) | US (50 state funds) | 4.2M | $110K (blended) | 60–70% (est.) | -2% (mixed) |
Conservative International Models
The most compelling international models are not progressive welfare states—they're market-oriented economies that happen to manage workforce transitions well:
- Singapore: Mandatory individual savings accounts (MediSave) + universal catastrophic insurance (MediShield Life) + workforce training credits (SkillsFuture). Spend 4.1% of GDP on healthcare (vs. U.S. 17.2%) with better outcomes. Heritage Foundation has repeatedly cited Singapore as a model. Individual responsibility + government catastrophic backstop + continuous training.
- Switzerland: Universal coverage through private insurance companies with government mandate. No government-run insurance. Market competition among 50+ private insurers. The model was inspired by Alain Enthoven—the same economist whose "managed competition" concept influenced Heritage Foundation proposals in the 1990s.
- Indiana HIP 2.0: Mike Pence's Medicaid alternative using Health Savings Account-style structures. Personal responsibility through monthly contributions and POWER Accounts. Conservative principles (consumer choice, market mechanisms, work encouragement) within public coverage framework.
Conclusion: The proposed AI Workforce Investment Framework ($110K per worker, private-sector-managed funds, SBIC model) is competitive with international models. It's more efficient than Germany ($1.3M/worker), more generous than U.S. TAA ($12K), and structured for private-sector management unlike most government programs. The GI Bill proved this approach works at scale. Singapore proves it works continuously. The SBIC model proves it works through private-sector management.
Chapter 39: The Five-Year Campaign — Timeline, Budget, and Decision Gates
Year-by-Year Campaign Plan (2025–2030)
2025: Foundation Year
- Release research (this report v2.0), launch bipartisan campaign coalition
- Identify legislative champions in all 10 target states—including GOP champions in OH, GA, TX, AZ
- Build conservative coalition partnerships (NAM, Chamber, R Street, Heritage workforce programs, veteran organizations)
- Draft state-specific bills using AI-Personalized State Legislative Engine (Chapter 40)
- Budget: $15–20M (research, communications, coalition infrastructure, AI Engine development)
2026: Legislative Push (Phase 1 — Transparency)
- Introduce Phase 1 bills in MA, WA, CA, CO (Tier 1) and NY, OH, AZ, OR (Tier 2)
- Committee hearings, amendments, floor debate. Georgia introduces Peach State Innovation Act
- Final passage and gubernatorial signatures in 4–6 states
- Begin dashboard development and commission staffing
- Budget: $25–30M (lobbying, media, grassroots, legislative support)
- Expected outcome: Phase 1 passes MA (80%), WA (75%), CA (75%), CO (70%). NY (55%), OH (55%) possible.
2027: Implementation & Phase 2 Launch
- Phase 1 dashboards operational in 4–6 states—real displacement data flowing
- Launch Phase 2 bills (investment obligation) in CA, WA, MA
- Additional states introduce Phase 1 (IL, MN, NM, NV, PA)
- Budget: $30–35M (implementation support, Phase 2 campaign)
2028: Federal Legislation & Phase 2 States
- Federal Phase 1 legislation introduced (bipartisan sponsors citing state data)
- Phase 2 passes in CA, WA, MA. OH and AZ consider Phase 2
- Federal Phase 1 passes (estimated 65–75% probability)
- Budget: $30–35M (federal campaign escalation)
2029–2030: Full Implementation
- Federal Phase 2 passes (estimated 55–70% probability with state proof points)
- State QAITFs operational; first job creation data emerges
- 15–20 states have Phase 1 transparency; 7–10 states have Phase 2 investment funds
- Budget: $20–25M (sustained advocacy, monitoring)
Four Decision Gates
Gate 1 (End 2026): Phase 1 passes in at least 3 of 4 Tier 1 states. If not, reassess strategy.
Gate 2 (Mid-2027): Dashboards launch with real data. If data shows <150K/year displacement, reassess scale. If data confirms 250K+/year, proceed to Phase 2.
Gate 3 (End 2028): Federal Phase 1 passes. If not, focus on state-level Phase 2.
Gate 4 (End 2030): Review first years of fund performance. If strong, proceed to expansion. If disappointing, restructure.
10 Rules for AI Economic Reform
- Make it bipartisan: AI displacement doesn't check voter registration. Include red, blue, and purple states. Frame as competitiveness, not ideology.
- Invest, don't tax: The primary mechanism is investment with a tax credit. The tax is the penalty for not investing. Language matters.
- Decentralize: 50 state funds, not one federal bureaucracy. Private sector-managed with public oversight. Local solutions for local workforce needs.
- Phase it: Transparency first (hard to oppose), then investment (based on data). Each phase builds constituency for the next.
- Make it self-funding: Funded by companies profiting from automation, not general taxpayers. Tax credit makes investment cheaper than the alternative.
- Give workers choice: Wage insurance OR retraining OR entrepreneurship support OR early retirement. Multi-track, not mandates.
- Engage employers: Companies that invest get tax credits, brand benefit, and workforce pipeline. Include them as partners, not adversaries.
- Use the GI Bill frame: Proven American precedent. Invest in people during transition. Returns dwarf costs.
- Cite the competitiveness gap: Every competitor has a workforce strategy. We don't. That's the most powerful argument across the political spectrum.
- Start now: 2025–2027 is the proactive window. After 2028, displacement peaks and policy becomes reactive. Speed matters.
Chapter 40: The AI-Personalized State Legislative Engine
The Strategic Dilemma: One Message Can't Win 50 States
The United States is not one political culture—it is at least six or seven, and arguably fifty. The libertarian individualism of the Mountain West is not the communitarian progressivism of the Pacific Coast, which is not the traditional conservatism of the Deep South, which is not the pragmatic populism of the Rust Belt. A message that says "competitive markets will reduce costs" makes intuitive sense in Arizona but sounds like code for "deregulation" in Massachusetts. A message that says "healthcare is a human right" resonates in San Francisco but triggers defensive hostility in rural Alabama.
Historical evidence is unambiguous: localized strategies win.
Historical Evidence: Localized vs. Unified Strategies
| Movement | Strategy | Outcome |
|---|---|---|
| Marriage Equality | Localized (state-by-state, customized framing) | Won — 27% → majority support, SCOTUS victory |
| Marijuana Legalization | Localized (different framing per state) | Won — 0 → 24 legal states by 2026 |
| ACA / Healthcare Reform | Unified ("affordable, quality healthcare") | Struggled — passed narrowly, remains controversial |
| Medicaid Expansion | Localized (state-specific names and framing) | Won — 40 states expanded (including red states) |
| Gun Control | Unified ("common-sense gun safety") | Mostly failed — despite 60-90% polling support |
The ACA's most successful component—Medicaid expansion—succeeded precisely where it was localized. Montana called it "HELP." Louisiana framed it as fiscal responsibility. Virginia framed it as "bringing Virginia tax dollars home." The national "ACA" brand struggled; the localized Medicaid expansion brand succeeded.
The Hybrid Solution: Unified Federal + Personalized State
The optimal strategy is a hybrid model:
- Strategy A (Unified) for federal: Consistent national message for federal legislation, national media, major coalition partners, donors. Umbrella brand: "The American AI Opportunity Act."
- Strategy B (Personalized) for states: AI-generated, state-specific legislative language, bill names, coalition strategies, lobbying kits, testimony templates, media campaigns—all customized to each state's unique political culture.
This is especially powerful for AI workforce legislation because each state has different industry concentrations, political cultures, and workforce profiles. The same policy—companies investing in workforce transition funds—can be framed as "Texas AI Workers First Act" (freedom, competition, local control) in Texas and "Massachusetts Healthcare & AI Opportunity Act" (Chapter 58 extension, innovation leadership) in Massachusetts. Same policy. Different political costumes.
The AI State Engine Architecture
State Customization Parameters
Each state is characterized across four dimensions that determine how AI-generated content is framed:
| Dimension | Texas | California | Ohio | Georgia | Arizona |
|---|---|---|---|---|---|
| Liberty ↔ Community | 85 (liberty) | 35 (community) | 55 (balanced) | 60 (moderate) | 80 (liberty) |
| Individual ↔ Collective | 80 (individual) | 35 (collective) | 55 (balanced) | 55 (moderate) | 75 (individual) |
| Market ↔ Government | 85 (market) | 40 (balance) | 50 (balanced) | 65 (market) | 75 (market) |
| Tradition ↔ Progress | 40 (tradition) | 80 (progress) | 45 (balanced) | 55 (moderate) | 50 (balanced) |
| Primary Frame | Populist | Social Justice | Communitarian | Pragmatic | Libertarian |
| Bill Name | TX AI Workers First | CA AI Opportunity | OH Workforce Resilience | Peach State Innovation | AZ AI Readiness |
Five Contrasting State Examples: Same Reform, Different Packaging
The following examples demonstrate how the same underlying policy—companies investing in workforce transition funds—gets expressed in five radically different political languages:
🔴 TEXAS: "Texas AI Workers First Act"
Opening message: "Out-of-state tech companies are automating Texas jobs without investing a dime in Texas workers. The Texas AI Workers First Act ensures that when companies profit from AI in Texas, those profits flow back to Texas workers—through voluntary training partnerships, retraining tax credits, and community college programs. No mandates. No Washington bureaucrats. Just Texas protecting Texans."
Power words: freedom, choice, competition, Texas-led, protecting Texans, local control
Taboo words: regulation, government program, mandate, universal, European model, tax
Lead coalition partner: Texas Farm Bureau, NFIB Texas, Texas Hospital Association
🔵 CALIFORNIA: "California AI Opportunity Act"
Opening message: "California workers built the tech industry. Now AI is transforming every sector of our economy. The California AI Opportunity Act ensures that AI's benefits are shared equitably—through advance notice protections, healthcare continuation, portable skills accounts, and investment in the diverse workforce that drives California's innovation economy. Accountability and opportunity, together."
Power words: equity, justice, community, innovation, accountability, inclusive, opportunity
Taboo words: deregulation, market-only solutions, colorblind, trickle-down
Lead coalition partner: California Labor Federation, CNA/NUHW, SEIU
🔴 OHIO: "Ohio Workforce Resilience Act"
Opening message: "Ohio workers have adapted before—from steam to electricity, from manual to CNC, from analog to digital. They'll adapt to AI too. But they need the tools. The Ohio Workforce Resilience Act creates practical, community-based transition support—reskilling through our community colleges, healthcare continuity during transition, and wage insurance so families can keep their homes. Common-sense support for Ohio workers and Ohio communities."
Power words: community, our hospitals, our jobs, practical, common sense, fair deal
Taboo words: coastal, progressive, disruption, transformation, innovation economy
Lead coalition partner: Ohio Hospital Association, UAW, Ohio Farm Bureau
🟣 GEORGIA: "Peach State Innovation Act"
Opening message: "Georgia is the #1 state for business and a rising AI leader through Georgia Tech and the Atlanta tech ecosystem. The Peach State Innovation Act ensures that AI's benefits flow to all Georgians—from Atlanta to Albany—through workforce training partnerships with our HBCUs, technical colleges, and community institutions. This is Georgia solving Georgia's problems, investing in Georgia's future."
Power words: Georgia-grown, business-friendly, innovation, faith, community, investment, opportunity
Taboo words: liberal, mandate, redistribution, Northern model, federal requirement
Lead coalition partner: Metro Atlanta Chamber of Commerce, Georgia Tech, HBCUs
🟣 ARIZONA: "Arizona AI Readiness Act"
Opening message: "Arizona's economy is diversifying fast—semiconductors, defense, tech. AI is the next wave, and Arizona should ride it, not be swept away. The Arizona AI Readiness Act prepares our workforce through ASU and U of A partnerships, community college certifications, and healthcare security during transition. Arizona solutions for Arizona workers. Independence, readiness, and choice."
Power words: choice, freedom, independence, Arizona solutions, local control, competition
Taboo words: mandate, federal, California model, regulation, government program
Lead coalition partner: Arizona Chamber of Commerce, ASU/U of A, tribal nations
Content Generation Pipeline
For each target state, the AI Engine generates a complete campaign kit through a 10-stage pipeline in 5–7 business days:
- Bill Name & Branding (Day 1): 5–7 candidate names scored for political culture fit
- Executive Summary (Day 1): 1–2 page summary using state's emotional triggers and data
- Full Bill Language (Days 2–3): Model legislation adapted to state code, government structure, legislative conventions
- Lobbying Kit (Day 3): Fact sheets, policy briefs, customized leave-behinds for each target legislator
- Media Kit (Day 3): Press releases, op-eds (4 versions by author type), social media packages
- Opposition Rebuttal (Day 4): Every known argument with 2–3 rebuttal options, rapid response templates
- Coalition Recruitment (Day 4): Customized pitches for business, labor, faith, veteran, rural, urban organizations
- Campaign Timeline (Day 4): Aligned with state legislative calendar, election cycles, budget cycles
- Budget & Fundraising Plan (Day 5): Cost estimates, donor prospects, grassroots plan
- Counter-Advertising Scripts (Days 5–7): TV, radio, digital, print, direct mail—all state-customized
Human Review Gate: Every output passes through two-layer review: (1) State coordinator reviews for political accuracy and cultural calibration, (2) Local coalition partner validates authenticity and community sensitivity. No content deploys without both approvals. The AI proposes; humans dispose.
Operational Model
Team scaling: The AI Engine enables sub-linear team growth. A 15–25 person team can manage campaigns in all 50 states—work that would traditionally require 200+ political consultants.
| Phase | States Active | Team Size | Traditional Equivalent |
|---|---|---|---|
| Pilot (2025) | 2–4 | 6 | 20+ |
| Expansion (2026) | 10 | 8–11 | 50+ |
| Scale (2027) | 20 | 11–16 | 100+ |
| National (2028+) | 35–50 | 16–23 | 200+ |
Rapid response: When opposition launches an attack in any state, the Engine generates counter-messaging customized to that state's political culture within 4 hours. This neutralizes one of industry opponents' biggest historical advantages—their ability to hire local political firms in every state.
Cross-state learning: Every campaign generates data on what framings, messages, and strategies work. The feedback loop refines the Engine's algorithms continuously. A successful framing in Ohio can be adapted for Pennsylvania within 2–3 days, adjusted for local political culture.
Chapter 41: AI-Powered Policy at Scale — Force Multiplication for Democracy
How This Campaign Was Built
Methodology: This entire Brainworks Policy Series (healthcare extraction in Parts I–III, AI workforce transition in Part IV) was built using AI policy research engines deployed at scale. The campaign strategy, economic modeling, legal analysis, competitiveness data, state political profiles, and legislative frameworks represent ~200,000+ words of analysis generated through coordinated AI agents. This is orders of magnitude faster than traditional policy development (which typically requires 2–3 years of expert consultant work at $50M+ cost).
Force Multiplication for Advocacy Organizations
| Capability | Traditional Campaign | AI-Powered Campaign |
|---|---|---|
| 50-state policy analysis | 50 researchers, 12–18 months, $10M+ | AI + 5 researchers, 8–12 weeks, $500K |
| State-customized bill drafting | 10 legislative counsel, 6 months/state | AI generates draft in days; counsel reviews in 1 week |
| Opposition research & rebuttal | Weeks to respond to new attacks | 4-hour rapid response, state-customized |
| Coalition recruitment materials | Generic pitch adapted manually | 8 customized pitches per state, per coalition type |
| Media content production | 1 press release, 1 op-ed per state | 20+ pieces per state (press, op-eds, social, scripts) |
| Total campaign cost | $100M+ over 5 years | $50M over 5 years (50% reduction) |
Section 2: The Startup Guide — How to Launch These Campaigns
This section provides a concrete, week-by-week playbook for a newly hired Campaign Director (or founding team) picking up these materials and launching the American AI Opportunity Act Campaign. The assumption is a small, well-funded team with AI acceleration tools from Day 1, using ready-made research, strategy, and legislative model bills to compress a traditional 18–24 month campaign preparation into 4–7 months.
Phase 1: Orientation & Team Assembly (Weeks 1–2)
Goal: The founding team reads the critical materials, understands the strategic architecture, and establishes operational infrastructure.
📖 Required Reading Order (First 5 Days)
- Day 1: Chapter 41 — understand the complete arsenal and asset deployment strategy
- Day 1–2: Executive Summary and Chapter 29 (The Workforce Transition Crisis) — understand the problem statement and scale
- Day 2–3: Chapter 39 (Five-Year Campaign Timeline), Chapter 32 (The Alvelda Framework), and Chapter 36 (Building the Coalition) — understand the strategic architecture and operational model
- Day 3–4: California legislative sequence (Chapter 35) — this is your first-mover state and template for replication
- Day 5: Chapter 37 (Opposition Playbook) and Fundraising Plan — prepare for anticipated attacks and revenue generation
Key Actions — Week 1:
- Campaign Director reads foundational documents per the reading order above
- Set up AI agent infrastructure: research agents, monitoring agents, content production pipeline
- Establish secure communications (encrypted email, Signal groups, shared document workspace)
- Begin recruiting Policy Director and Coalition Manager (the two most critical early hires)
- Set up CRM for stakeholder tracking (import contacts from power map documents)
Key Actions — Week 2:
- Policy Director reads all research documents and model bills in detail
- AI agents begin monitoring: state legislature calendars, relevant committee hearings, media coverage
- Draft initial outreach list of top 25 coalition partners (from stakeholder mapping documents)
- Establish fiscal sponsor or 501(c)(4) entity for campaign operations
- Set up donation infrastructure (ActBlue or equivalent for small-dollar; major donor pipeline)
Phase 2: Coalition Building Launch (Weeks 3–4)
Goal: Begin active outreach to potential coalition partners using the stakeholder maps and coalition strategy documents.
First Wave Coalition Targets:
- Core labor unions: SEIU (2.3M members), CWA (700K members, critical for tech worker buy-in), AFL-CIO (federation leadership), United Steelworkers (automation transition experience), NEA + AFT (retraining program design)
- Tech worker groups: Tech Workers Coalition, responsible tech movement leaders. Frame as "responsible AI" and "ethical technology innovation"—NOT anti-tech
- Economic development & workforce: State workforce development boards, economic development agencies, community college associations
- Academic & policy institutions: Economic Policy Institute, Brookings Institution, RAND Corporation, state-level policy institutes
- Forward-thinking business leaders: Impact investors, venture capitalists with social mission alignment. Frame as "market-driven solution to labor transition"
⚡ AI Acceleration Advantage: Coalition Building
AI agents produce personalized outreach packages for each potential partner in minutes rather than days. Each package includes: a tailored 2-page brief showing how the campaign aligns with the partner's existing priorities, relevant data from research documents, and a draft MOU. A traditional campaign would spend 4–6 weeks preparing these materials manually. With AI acceleration: 5 days.
Phase 3: Legislative Introduction (Month 2)
| Action Item | Materials Used | Timeline |
|---|---|---|
| Identify potential sponsors in CA legislature | Political landscape doc, stakeholder power map, contacts database | Week 5 |
| Sponsor briefings (3–5 key legislators) | 2-page fact sheet, lobbying talking points (Ch. 37), economic impact brief | Week 5–6 |
| Secure lead sponsors and co-sponsors | California model bill, fiscal notes, QAITF structure explainer | Week 6–7 |
| File bills in California Assembly/Senate | Complete model bill — sponsor's office customizes for their district | Week 7–8 |
| Begin Washington state parallel track | WA political landscape, WA legislative sequence, B&O tax analysis | Week 8 |
| Prepare committee testimony packages | Testimony template (Ch. 37), economic impact exhibits, expert witness list, opposition rebuttals | Week 7–8 |
Phase 4: Campaign Execution (Months 3–6)
- Media operations: AI agents produce 3–5 op-eds per week, customized for local newspapers in target districts. Press releases coordinated with every legislative milestone. Social media: 20+ posts per day across platforms.
- Grassroots mobilization: AI-generated phone scripts, door-knock scripts, and town hall briefing packages. Targeted by district using displacement impact data.
- Legislative advocacy: Weekly legislator briefings during session. AI real-time monitoring of amendment activity and committee dynamics. Opposition tracking with rapid-response rebuttals.
- Fundraising: Major donor cultivation using AI-researched prospect profiles. Grant applications going out weekly. Small-dollar digital campaigns tied to legislative milestones.
Phase 5: Adaptation & Expansion (Month 6+)
The entire campaign architecture is designed for rapid, systematic replication. Each state campaign follows the same template:
- State Assessment: Use AI displacement impact data and political readiness matrix to identify next targets
- Localization: AI agents adapt model bill to state-specific statutory language and talking points (24–48 hours of AI work + 2–3 days of human review)
- Launch: Deploy the same 5-phase sequence, compressed by operational experience
- Cross-pollination: Victories in early states become case studies and political leverage for subsequent states
- Scaling advantage: Each additional state requires only 1 dedicated State Coordinator + AI agent support. Per-state cost decreases 70% by Phase 3
Section 3: AI-Accelerated Fundraising Plan
The American AI Opportunity Act Campaign requires estimated funding of $22–80M over five years (median $51M). AI acceleration transforms fundraising from a bottleneck into a competitive advantage, enabling a small team to execute what traditionally requires a large development infrastructure.
AI-Powered Donor Research
AI research agents continuously scan foundation databases (Foundation Directory Online, Candid/GuideStar), SEC filings, donor disclosure records, and public giving histories to identify aligned funders. Production target: 200+ qualified prospects identified per month (vs. 20–30 with traditional research staff).
Grant Writing at Scale
AI drafting agents produce complete grant applications—narrative, budget, logic model, evaluation plan—in 4–6 hours per application. Production target: 10–15 grant applications per week (vs. 1–2 with traditional staffing). At a 15–20% success rate, this yields 80–150 funded grants per year.
Revenue Projections by Year
| Year | Grassroots | Mid-Level | Major Gifts | Institutional | Total (Low–High) |
|---|---|---|---|---|---|
| Year 1 | $0.3–1M | $0.4–1.5M | $0.8–2.5M | $1.5–4M | $3–9M |
| Year 2 | $0.7–2.5M | $0.8–3M | $1.5–5M | $2.5–8M | $5.5–18.5M |
| Year 3 | $1–4M | $1–4M | $2.5–7M | $3–10M | $7.5–25M |
| Year 4 | $0.8–3.5M | $0.8–3.5M | $1.5–6M | $2.5–8M | $5.6–21M |
| Year 5 | $0.8–4M | $0.4–4M | $1.5–5M | $2.5–10M | $5.2–23M |
| 5-Year Total | $3.6–14.5M | $3.4–15.5M | $7.8–25.5M | $12–40M | $26.8–95.5M |
Budget Allocation Guidelines
- Personnel (Development Director + support): 35–40% of fundraising budget
- Technology (CRM, AI tools, email platform): 15–20%
- Events and cultivation: 20–25%
- Digital advertising and campaigns: 15–20%
- Travel and donor meetings: 5–10%
AI acceleration shifts the ratio: less personnel spend (AI handles 60% of production work), more technology spend, and significantly higher output per dollar invested.
Section 4: AI-Accelerated Staffing Plan
Core insight: a team of 5–8 humans, augmented by a fleet of specialized AI agents, can accomplish what traditionally requires 30–50 people.
Core Team Role Definitions
| Role | Salary Range | Hire Phase | Key Responsibilities |
|---|---|---|---|
| Campaign Director | $180–220K | Founding | Overall strategy, stakeholder relationships, board management, media spokesperson |
| Policy Director | $160–200K | Week 1–2 | Policy research, model bill development, legislative testimony, economic analysis. Directs research and drafting AI agents |
| Coalition Manager | $130–160K | Week 1–2 | Coalition partnerships, stakeholder database, coalition meetings, MOUs, inter-partner conflict resolution |
| Communications Lead | $130–160K | Week 3–4 | Media strategy, content AI agents, press relationships, social media campaigns, crisis communications |
| Development Director | $140–180K | Week 3–4 | All fundraising: major donors, grants, digital campaigns, events. Directs AI-powered donor research and grant writing |
| AI Operations Lead | $150–190K | Week 1 | AI agent fleet management: configuration, quality control, output review, prompt engineering, tool integration |
| State Coordinator(s) | $100–130K each | Month 3+ | On-the-ground operations in target states. Local coalition, committee hearings, grassroots events |
| Legal Counsel | $180–220K (or retainer) | Month 3+ | ERISA analysis, Constitutional strategy, bill drafting review. Can be part-time/retainer initially |
Staffing Cost Projections
| Cost Category | Phase 1 (Yr 1) | Phase 2 (Yr 2–3) | Phase 3 (Yr 4–5) |
|---|---|---|---|
| Core team salaries | $600K | $880K | $1.44M |
| Benefits & overhead (30%) | $180K | $264K | $432K |
| AI tools & infrastructure | $120K | $200K | $350K |
| Office & operations | $120K | $250K | $400K |
| Travel | $80K | $150K | $250K |
| State-level operations | $130K | $330K | $770K |
| Total Annual Cost | $1.23M | $2.08M | $3.64M |
| Cost per state | $615K | $416K | $182K |
AI Agent Fleet: Detailed Capabilities
🤖 Research Agents (Always Running)
- Legislative monitoring: Track every bill in target states related to AI, workforce displacement, automation taxation. Daily digest to Policy Director.
- Opposition research: Monitor industry lobbying disclosures, PAC spending, think tank publications. Weekly threat assessment.
- Academic scanning: Monitor arXiv, NBER, SSRN, and policy journals. Quarterly literature review updates.
- Polling and sentiment: Aggregate public polling data, social media sentiment, community forum discussions. Real-time dashboard.
🤖 Drafting Agents (On-Demand)
- Grant applications: 10–15 per week, 4–6 hours per application (vs. 20–40 hours traditionally)
- Bill amendments: Revised text with tracked changes and legal analysis in hours
- Testimony preparation: Complete packages including opening statement, Q&A prep (50+ anticipated questions), supporting exhibits
- Policy briefs: Rapid-turnaround 2–4 page briefs on emerging issues. Same-day delivery.
🤖 Content Agents (Daily Production)
- Op-eds: 3–5 per week, customized for local newspapers in target districts
- Social media: 20+ posts per day across platforms, tied to news cycles
- Email campaigns: Weekly supporter emails, fundraising appeals, action alerts with full A/B testing
- Video scripts: Short-form video scripts for TikTok, Instagram Reels, YouTube Shorts
Training Protocol for New Team Members
- Week 1, Days 1–3: Read assigned report sections (tailored to role)
- Week 1, Days 4–5: AI tools training — hands-on practice with the agent fleet, prompt engineering, quality control workflows
- Week 2, Days 1–3: Shadow existing team members, attend coalition meetings, observe legislative interactions
- Week 2, Days 4–5: Solo execution of a complete task cycle (e.g., produce a policy brief using AI agents, get it through review)
Section 5: Measuring Success — KPI Framework
The campaign requires rigorous, data-driven performance measurement at legislative, financial, coalition, and media levels. This framework ensures accountability, enables rapid course correction, and provides funders with clear evidence of progress.
Key Performance Indicators
| Category | KPI | Year 1 Target | Year 3 Target |
|---|---|---|---|
| Legislative | Bills introduced | 2 (CA + WA) | 5+ (CA, WA, NY, IL, MA) |
| Committee hearings secured | 2–4 | 10–15 | |
| Committee passage | 1 bill minimum | 2–3 bills | |
| Floor votes | 0–1 | 1–2 | |
| Financial | Total funds raised | $3–9M | $15–30M cumulative |
| Grant success rate | 15–20% | 25–35% | |
| Donor retention rate | N/A (first year) | 65–75% | |
| Coalition | Formal coalition partners | 20–35 | 75–125 |
| Endorsing organizations | 40–60 | 200–300 | |
| Grassroots supporters | 8,000–20,000 | 50,000–150,000 | |
| Media | Earned media placements | 40–80 | 250–400 |
| Op-eds published | 25–40 | 80–120 | |
| Social media followers | 8,000–25,000 | 75,000–200,000 |
Review Cadence
Monthly Reviews
- All KPIs reviewed against targets
- AI monitoring dashboard: legislative activity, media sentiment, fundraising pipeline
- Budget vs. actuals analysis
- Coalition partner status check (new partners, at-risk relationships)
- Course correction recommendations with AI-generated options analysis
Quarterly Strategic Reviews
- Deep-dive on campaign trajectory vs. 5-year plan
- State-level performance comparison: which strategies are working, which need adaptation
- Donor and funder reporting with impact metrics
- AI agent fleet performance audit: output quality, efficiency gains, tool upgrades
- Board/advisory committee briefing
Decision Gates & Pivot Triggers
| Gate | Trigger Condition | Decision |
|---|---|---|
| Month 6: Go/No-Go | At least 1 bill in committee + $2M+ raised + 15+ coalition partners | Proceed to Phase 2 (add 3 states) or consolidate |
| Year 1: Viability | At least 2 bills introduced + $4M raised + 25 coalition partners | Full acceleration to Phase 2 or strategic pivot |
| Year 2: Momentum | At least 1 committee passage + growing media coverage | Scale to 5 states or intensify focus on 2 most promising |
| Year 3: National | At least 1 floor vote + significant public awareness + $20M+ cumulative | Launch national expansion or prepare federal push |
| Any Time: Victory | First state passes legislation | Massive media push, rapid replication, federal bill introduction |
This arsenal contains everything needed to launch, fund, staff, and scale the American AI Opportunity Act Campaign. The research is complete. The strategies are written. The model bills are drafted. The lobbying kits are packed. The AI infrastructure is designed and tested. The coalition map is drawn. The fundraising roadmap is detailed. What remains is execution—and these operational sections provide the complete execution manual.
The Democratic Multiplier
The same artificial intelligence that is transforming the workforce and extracting wealth from healthcare can, if directed toward democratic participation and policy formation, become an engine for equitable reform and responsive governance. The AI State Legislative Engine enables smaller advocacy organizations to punch above their weight—producing state-customized content at the quality and speed that was previously available only to the wealthiest industry lobbying operations.
The difference is not technical; it is political—a choice about what problems we direct AI to solve.
Bibliography & Sources
- McKinsey Global Institute. (2023). "Generative AI and the Future of Work." McKinsey & Company.
- World Economic Forum. (2024). "Future of Jobs Report 2024." WEF.
- OECD. (2024–2025). "AI and the Future of Work"; "Skills Outlook 2025"; "Employment Outlook 2024." OECD Policy Papers.
- Case, A., & Deaton, A. (2020). "Deaths of Despair and the Future of Capitalism." Princeton University Press.
- Jacobson, L., LaLonde, R., & Sullivan, D. (2005). "Estimating the Returns to Community College Schooling for Displaced Workers." Journal of Econometrics.
- Madrian, B. (1993). "Employment-Based Health Insurance and Job Mobility." Quarterly Journal of Economics.
- Harvard Kennedy School. (2025). "Reskilling America: Effective Workforce Development in an Age of Automation."
- Brookings Institution. (2025). "The Future of Job Training in America"; "The Startup Ecosystem and Job Creation."
- German Ministry for Economic Affairs. (2025). "Kohleausstieg Strukturwandel" (Coal Exit Structural Change).
- European Commission. (2021–2026). "Just Transition Mechanism"; "EU AI Act." ec.europa.eu.
- SkillsFuture Singapore. (2025). "Skills Demand for the Future Economy Report." skillsfuture.gov.sg.
- State Council of China / Xinhua. (2025–2026). "AI Plus Initiative Guidelines."
- KFF. (2025). "Employer Health Benefits Survey." kff.org.
- Peterson-KFF Health System Tracker. (2026). "Health Spending and Competitiveness Data."
- Peter G. Peterson Foundation. (2025). "Healthcare Spending and Administrative Costs."
- CFPB. (2024–2025). "Medical Debt in America." Consumer Financial Protection Bureau.
- Congressional Research Service. (2025–2026). "CHIPS and Science Act"; "Military Health System Budget." CRS Reports.
- Alexander Hamilton Society. (2025). "Defense Manufacturing Workforce Gap Analysis."
- ITIF. (2017). "Manufacturing Job Loss: Trade vs. Productivity." Information Technology and Innovation Foundation.
- Mercer-Mettl. (2025). "India Graduate Skill Index 2025."
- Niskanen Center. (2023). "Universal Catastrophic Coverage: Principles for Bipartisan Health Care Reform."
- Arnold Ventures. (2025). "Evidence-Based Healthcare Reform." arnoldventures.org.
- Urban Institute. (2025). "Indiana Healthy Indiana Plan Federal Evaluation."
- U.S. Census Bureau / BLS. (2024). "Current Population Survey"; "Occupational Employment Statistics."
- Preqin / Cambridge Associates / Crunchbase / PitchBook. (2024). "Venture Capital Performance and Startup Funding Data."
- Bill of Rights Institute; Scholars Strategy Network. "GI Bill Economic Impact Analysis."
- Second Talent. (2026). "China AI Investment Report 2026."
- Economic Innovation Group. (2024). "Opportunity Zones Investment Data."
- Congressional Research Service. "Small Business Investment Company (SBIC) Program." R41456.