
Submission — Memorandum in Response to the RFI
Submitted August 4, 2026
Memorandum to Senator Ron Wyden, Ranking Member, and the Democratic Members of the Committee on Finance, United States Senate


An Analysis of and Response to the Senate Finance Committee's Insurance Reform Proposal, which leaves most of the healthcare cost problem unaddressed.
Senate Finance Committee Democrats have described, more honestly than any committee before them, how insurers profit by denying care — then proposed a plan that misses 68 to 76 percent of the problem, $382 billion a year, most of it hospital pricing. Reform has to reach hospitals, and has to raise the audited share of each dollar reaching care across whole conglomerates, not one subsidiary.
This 86-page request for evidence (July 30, 2026; responses due October 2) will draft the next health bill. What it omits now stays omitted (p002 — page cites refer to that document).
The diagnosis is right, and the Committee's own numbers convict. Denying care is how insurers make money, not bad administration (p059-060). Insurers keep "nearly $1,000 per enrollee annually in overhead and profit" (p071); the rule written to claw that back returned "approximately $200" (p077). Nineteen percent of 2024 claims were denied — 85 million, on care already agreed to — and 0.3 percent were appealed (p055). SOURCED.
But the proposals regulate insurers and nothing else, which is 24 to 32 percent of the money that does not buy care. Hospitals are the largest untouched piece, $306 billion ESTIMATED, paid 254 percent of Medicare for identical inpatient care. SOURCED18. Across 86 pages, "facility fee," "provider consolidation," "market power," "monopoly" and "antitrust" appear zero times. How insurers behave decides how the dollars get fought over. What hospitals charge decides how many dollars there are.
And a rule aimed at one company in a group moves money rather than saving it. The Medical Loss Ratio "applies only to the insurance entity rather than the parent company" (p077) — the Committee's own proof that a conglomerate escapes a cap by overpaying the physician group it also owns.
This report rates all 71 proposals on care-dollar share, usable access, and gameability (Exhibit 1), and Exhibit 7 names where each gameable one sends the money. Press in this order: benchmark affiliate payment rates; bar utilization management from counting as quality improvement; measure the parent before capping the subsidiary; cap what hospitals charge commercial plans. The largest absences are volumetric liability for wrongful denials and a provider-side price instrument (Section 7).
One number settles whether it worked: the audited care-dollar share across the parent and everything it owns, required to rise 5 percentage points in five years against a baseline that does not yet exist. It drifts ±2 points a year unaided, so insurer-only reform is indistinguishable from doing nothing (Section 12).
Extend these proposals to hospitals and to whole companies, and the Committee goes from inconveniencing a quarter of the money to recovering most of it for care.
Contents
- The Committee's diagnosis is right, and the damning numbers are its own
- The plan does not reach 68 to 76 percent of the problem
- A rule aimed at one company in a group moves the money rather than saving it
- Three measures that would actually move money back to care
- What the plan cannot see at all
- One number decides whether any of it worked
- The plan leaves out 68 to 76 percent of the problem it is trying to solve
- Squeeze one part of a company and the money moves to another part of the same company
- Three things the plan gets wrong about its own subject
- Three measures that would actually move money back to care
- Nine components, and the one number that decides whether any of it worked
- What to submit by October 2, and in what order
- 1. The verdict
- 2. Three questions to ask of every proposal
- 2.1 Axis 1 — Care-dollar ratio
- 2.2 Axis 2 — Accessibility and affordability, nominal versus effective
- 2.3 Axis 3 — Gameability
- 3. Exhibits
- Exhibit 1 — Three-axis scorecard
- Exhibit 2 — AI-durability matrix
- Exhibit 3 — Transparency-precondition register
- Exhibit 4 — Gap register
- 4A. This is the blueprint for the next Democratic health bill, and it is a document about insurers only
- 4A.1 The document's own standard, and its own provenance
- 4A.2 Page and section allocation
- 4A.3 Term frequency, and the distinction that matters more than frequency
- 4A.3a The hospital case, stated at its strongest, before we test it
- The case, in its own terms
- What we concede, plainly
- Where the case does not carry, on this report's own evidence
- 4A.4 The hospital finding, and why it is the strongest evidence in this report
- 4A.4a Price is the base. Conduct is the contest.
- Exhibit 5 — The hospital price base, and where the RFI's perimeter stops
- 4A.4b The victim frame, and why it makes hospital pricing unaskable
- 4A.4c Independent corroboration: a second method reaches the same finding
- Exhibit 6 — The coverage matrix
- 4A.5a Depth: private equity, and why we carry no dollar figure
- Why no aggregate is defensible
- What the evidence actually supports — mechanism, named cases, and identified price effects
- The recommendation this produces, and it is within this Committee's jurisdiction
- 4A.5b The $306 billion hospital figure: what it is, and how it is built
- Why the components are not additive
- The construction, with the method shown
- What this figure is, and what it is not
- 4A.5c The $95 billion site-of-service line, and the published figure that does not support it
- 4A.5d The benchmark objection: why "above Medicare" is not automatically "extraction"
- 4A.6 Depth: stock buybacks and executive compensation
- 4A.7 Depth: hospital lock-in arbitrage, and a counterintuitive finding about network adequacy
- 4A.8 Why: jurisdiction, tested and largely rejected
- 4A.9 Why the omission is total: the frame does the work
- 4A.10 Consequences, tested
- 4B. Why capping insurer margins moves the money instead of saving it, and what would not
- 4B.1 The general law
- 4B.2 The three relocation routes
- Route 1 — VERTICAL: margin moves to an affiliate outside the rule's perimeter
- Route 2 — HORIZONTAL: reclassify the same activity into a favourably-treated category
- Route 3 — CROSS-CHAIN: pass the squeeze to a link that is not regulated at all
- 4B.3 Empirical precedents
- Exhibit 7 — Relocation register
- 4B.5 The prescriptive counterpart: four design principles
- Principle 1 — PERIMETER COMPLETENESS
- Principle 2 — CHAIN COMPLETENESS
- Principle 3 — SIMPLICITY AND CLARITY AS ENFORCEMENT INFRASTRUCTURE
- Principle 4 — TRANSPARENCY AS PRECONDITION, NOT REMEDY
- 4B.6 Synthesis and falsifiable prediction
- 4C. How the RFI's own numbers compare with ours
- 4C.1 Where the RFI and our model measure the same channel
- 4C.1a Where the RFI's own cited sources do not support its text
- 4C.2 The scope discipline that must not be violated
- 4C.3 Channels our model identifies that the RFI misses
- 4C.4 Where the new evidence cuts against our own thesis
- 5. The diagnosis is strong; the remedies do not follow from it
- 5.1 Verification of the framing statistics
- 5.2 The proportionality test
- 5.3 The pattern
- 5.4 The one place the RFI gets proportionality exactly right
- 6. Disclosure is the first step, not the reform itself
- 6.1 The RFI concedes the case, twice
- 6.2 Why consumer price transparency was always decorative
- 6.3 What transparency would have to specify to actually work
- 6.4 The delay blind spot
- 6.5 Intercompany transfers: whether the RFI closes the channel
- 7. What actually moves money back to care
- 7.1 The ranking
- 7.2 Derivations
- 7.3 What is missing entirely
- 7.4 The enforcement dividend
- 7.5 Two levers that look good and are not
- 8. Automation is how care gets denied at scale, and the RFI barely mentions it
- 8.1 What the RFI actually says
- 8.2 Volume and velocity
- 8.3 Attrition as the business model
- 8.4 Delay as a harm distinct from denial
- 8.5 Burden as rationing
- 8.6 Violation of payers' own rules
- 8.6a The other half of the machine: hospital revenue-cycle AI
- 8.7 Closing the loop: which remedies change the outcome signal
- 9. Chronic illness and long COVID appear nowhere in 86 pages
- 9.1 The verified counts
- 9.2 An honest disclosure
- 9.2a Long COVID in children: what the evidence actually supports, and why the policy argument does not rest on the headcount
- Exhibit 8 — The disability discontinuity
- 9.3 Why this population is the system's hardest case
- 9.4 The three axes, applied
- 9.5 Why this is the case study that demonstrates the whole mechanism
- 10. Instrument, authority and litigation durability
- 10.1 The instrument each remedy requires
- 10.2 Why arithmetic survives review better than discretion
- 10.3 The ERISA preemption blind spot
- 11. All 71 proposals, rated one by one
- 11.1 Enhanced rate review covering administrative cost growth and utilization management (p020)
- 11.2 Capped rate increases (p021)
- 11.3 Prohibiting or limiting coinsurance as a utilization management tool (p024)
- 11.4 Commercial-market oversight entity, a MedPAC analogue (p029-030)
- 11.5 Prior authorization: gold carding (p051)
- 11.6 Prior authorization: limitations or bans, including for chronic conditions (p051)
- 11.7 Presumptive approval of in-network care, burden shifted to the plan (p052)
- 11.8 Approval on timeout, with penalties for clock gaming (p053)
- 11.9 Codifying the 2025 voluntary industry prior-authorization pledge (p053-054)
- 11.10 Independent claims adjudication entity (p056, p059)
- 11.11 Automatic external review without patient initiation (p058)
- 11.12 Independent billing and coding clearinghouse (p061)
- 11.13 Consequential remedies and a private right of action (p065)
- 11.14 Barring utilization management from quality-improvement classification (p078)
- 11.15 MLR modernisation: fee-based caps and disallowing internal markups (p079)
- 11.16 TPA and ASO reform: fee structure, fiduciary duty, MLR extension (p081-082)
- 11.17 Buyback and executive-compensation limits (p072)
- 11.18 System-wide transparency and all-payer claims databases (p085-086)
- 12. What a plan with real, measurable, enforceable impact requires
- 12.1 Perimeter completeness: regulate the group, not the subsidiary
- 12.2 Chain completeness: the unregulated link is where the squeeze lands
- 12.3 Transparency as precondition: disclosure first, caps second
- 12.4 The capture constraint, not the disposition constraint
- 12.5 The hospital price base: the component the RFI cannot contain
- 12.6 Algorithmic accountability on both sides of the claim
- 12.7 Simplicity as enforcement infrastructure
- 12.8 Chronic illness and effective access
- 12.9 Medicare Advantage overpayment, and why ownership-only diagnoses fail
- 12.10 Network availability, price discrimination against independents, and outcome accountability
- 12.10.1 Availability, not roster membership
- 12.10.2 Presumptive approval must extend out of network when in-network care is unobtainable
- 12.10.3 Payment discrimination against independent practice, and internal most-favoured pricing
- 12.10.4 Rate and regulate on outcomes, not only on process
- 12.11 Measurement and enforcement
- Appendix A. Methodology, sources and value labels
- A.0 How this analysis was made, and by whom
- A.1 Value labels
- A.2 Source document
- A.3 Method
- A.4 Verification protocol
- A.5 Working notes and audit trail
- A.6 Limitations
- A.7 How this analysis was produced
- Appendix B. Bibliography
Exhibits
- Exhibit 1 — Three-axis scorecard
- Exhibit 2 — AI-durability matrix
- Exhibit 3 — Transparency-precondition register
- Exhibit 4 — Gap register
- Exhibit 5 — The hospital price base, and where the RFI's perimeter stops
- Exhibit 6 — The coverage matrix
- Exhibit 7 — Relocation register
- Exhibit 8 — The disability discontinuity
- Exhibit 9 — Headline metrics, baselines, targets, cadence and enforcement
- Exhibit 10 — How each metric gets gamed, and what closes the route
The Committee's diagnosis is right, and the damning numbers are its own
Denying and delaying care is how insurers make money. That is not our characterisation; it is the RFI's (p059-060), and it is the most honest account of the business any committee has published. Insurers keep "nearly $1,000 per enrollee annually in overhead and profit" (p071). The rule written to claw that back returned "approximately $200" (p077) — one dollar in five, printed six pages apart in the same document and never set side by side. Nineteen percent of claims were denied in 2024, 85 million of them (p055), on care from doctors and hospitals the insurer had already agreed to cover. 0.3 percent were appealed. SOURCED. A denial engine that expects to be challenged three times in a thousand is not administering a policy; it is pricing an outcome. Sections 1 and 5.
The plan does not reach 68 to 76 percent of the problem
Of the money paid into American healthcare that does not buy care, insurers account for 24 to 32 percent. The proposals regulate insurers and nothing else. The remaining 68 to 76 percent — $382 billion a year — is outside the perimeter. ESTIMATED; it is the only aggregate this report carries, quantified here and absent from the Committee's own accounting.
The largest single piece is hospital pricing, at $306 billion ESTIMATED. Commercial insurance pays hospitals 254 percent of what Medicare pays for the same inpatient care. SOURCED18. Across 86 pages, "facility fee," "provider consolidation," "market power," "monopoly," "antitrust" and "algorithm" appear zero times — verified by exhaustive search of all 86 page files. Hospitals are 31 percent of national health expenditure and appear in this document almost exclusively as victims of insurers.
How insurers behave decides how the dollars get fought over. What hospitals charge decides how many dollars there are. A reform that reaches only the first cannot move the second. Sections 4A and 12.5.
A rule aimed at one company in a group moves the money rather than saving it
The Medical Loss Ratio "applies only to the insurance entity rather than the parent company" (p077). Again the Committee's own words, and its own proof of the defect: a conglomerate escapes a margin cap by overpaying the physician groups, the drug-benefit middleman or the billing contractor that it also owns. The money never leaves the group; it changes which subsidiary reports it.
Nor is common ownership the mechanism. $76 billion a year of Medicare Advantage overpayment arises inside a government programme, chiefly through favourable selection and coding intensity rather than through anything a parent company owns. SOURCED42. Any remedy built on ownership tests alone misses it.
For 34 of the 71 proposals we rated, we can name the specific place the money would move to. That is the central structural finding of this submission, and it is why the perimeter, not the rate, is the design question. Sections 4B and 12.1–12.2.
Three measures that would actually move money back to care
Ranked by dollars moved per unit of political difficulty, allowing for how easily each can be dodged.
1. Ban companies from marking up what they charge themselves. Benchmark affiliate payments against an unrelated company's price for the same service (p076, p079). Reaches up to 14.5 percent of money flowing between affiliates, roughly 4.8 percent of total revenue at the most integrated conglomerate. ESTIMATED. Hard to dodge. The RFI's ask on this point is to "invite comments."
2. Prohibit counting the machinery of denial as "quality improvement" spending (p078). Small in direct dollars and the keystone of the set, because it is what makes the headline ratio mean what it claims to mean. Hard to dodge, by regulation alone. The RFI's ask: "invite feedback."
3. Change profit and administrative caps from a share of spending to a flat fee per member (p079). $40 billion to $90 billion annually. ESTIMATED. Partial — it removes the incentive to inflate spending, but it also removes the insurer's own reason to resist hospital price increases, so the money escapes down the chain unless a hospital-side measure is paired with it.
Exhibit 1 rates 24 of the 71 proposals STRONGLY POSITIVE at low or medium gameability — strong ideas that are hard to dodge. Where the Committee still asks whether rather than how, we supply drafted legislative text: federal premium-rate authority, the MLR rewrite, the public option. The largest missing lever inside insurance is absent altogether — making wrongful denials cost money in proportion to how many are overturned. Sections 7 and 11.
One counterintuitive verdict, stated because it cuts against us: minimum in-network hospital requirements may worsen lock-in in concentrated markets, stripping the insurer of its only credible threat to walk away. The RFI gets this structure right exactly once — Cascade Select's mandatory participation at 160 percent of Medicare (p031) — and never generalises it.
What the plan cannot see at all
Two harms are invisible to every instrument the RFI proposes. Care that is nominally covered, formally approved and never obtainable produces no denial and no delay metric — no record of any kind. Ghost networks appear once (p048), as a directory-accuracy problem. And chronic illness and long COVID appear nowhere: those terms and "ME/CFS" appear 0 times in 86 pages; "chronic" appears once (p051). Verified. Adequacy must therefore be measured as realised availability — whether a patient can obtain an appointment inside the window their condition requires — not as the count of names on a list. Sections 9 and 12.10.
One number decides whether any of it worked
The care-dollar ratio: the share of every dollar entering the system that reaches care, audited across the parent and every business it owns. A reform is real only if it raises that ratio by at least 5 percentage points within five years, against a baseline a regulator has actually published — of which today none exists. ANALYST.
Five points is demanding by design. The ratio drifts ±2 points a year unaided, so insurer-only reform would be statistically indistinguishable from doing nothing. Three of the five headline measures have no baseline in existence — no US filing produces a group-wide care-dollar ratio, nobody tracks affiliate price premiums, nothing records how long patients wait. The first deliverable of any serious plan is therefore the measurement, not the cap. The full standard, with baselines, penalties and the anti-gaming register, is Section 12.11.
If a proposal cannot be graded against that test, it is not a reform. It is an announcement.
Senate Finance Committee Democrats have described, more honestly than any committee before them, how insurers profit by denying care, then proposed a plan that fails to address 68 to 76 percent of the larger healthcare cost problem — $382 billion a year, the largest omission being hospital pricing. Genuine reform requires a wider perimeter and a measurable target: a 5-percentage-point rise in the audited share of each dollar reaching care, within five years, across conglomerates practiced in shifting margins to unregulated affiliates.
The diagnosis is right, and the damning numbers are the Committee's own — denial is the business model, not administrative failure (p059-060) SOURCED:
| The Committee's own numbers | |
|---|---|
| Overhead and profit insurers keep per enrollee | "nearly $1,000" annually (p071) |
| Returned by the rule written to claw that back | "approximately $200" (p077) — six pages apart, never compared |
| Claims denied in 2024, in-network | 19 percent · 85 million (p055) |
| Appeal rate against them | 0.2 percent (p057; ~1 percent in 2024) |
The proposals would not stop it, because they regulate insurers and nothing else. 24 to 32 percent of money paid into American healthcare does not buy care — $1.8-2.4 trillion. The Committee concedes its central tool, the Medical Loss Ratio, "applies only to the insurance entity rather than the parent company" (p077), and more than 60 percent of workers are in self-insured plans it never reaches (p062).
What the plan leaves out is the price of care itself: $382 billion a year ESTIMATED — the only aggregate this report carries, its arithmetic hospital extraction $306B + Medicare Advantage overpayment $76B. Hospitals are 31 percent of national health spending and commercial insurance pays them 254 percent of what Medicare pays for the same inpatient care SOURCED18. How insurers behave decides how the dollars get fought over. What hospitals charge decides how many dollars there are. Nor is this about ownership: that $76 billion is 11 percentage points favourable selection and 4 coding intensity (MedPAC March 2026 Report, Ch. 12) SOURCED42 — inside a government programme.
One number would settle whether any of this worked: the care-dollar ratio — the share of every dollar entering the system that reaches care, counted across the parent and every business it owns. A proposal that cannot be graded against that test is an announcement, not a reform.
The plan leaves out 68 to 76 percent of the problem it is trying to solve
The RFI sets its own standard on page 4 — reforms making "every industry in the health care sector" contribute (p004) SOURCED — then spends 86 pages on one of them. Present: insurer / health plan 279 · prior authorization 75 · denial 64 · TPA 52 · MLR 55. Zero occurrences, verified across all 86 pages: provider consolidation · facility fee · site of service · market power · monopoly · antitrust · charity care · tax-exempt · chargemaster · 340B · upcoding · risk score · algorithm. Hospital as an extractive actor: 0.
"Hospital" appears 57 times — ally, fellow victim of paperwork, payment recipient — never as something that sets a price. The RAND hospital-price study and Godwin and Levinson's "Hospital Prices Have Risen Much Faster for Private Insurance Than Medicare" are cited three times (p019, p034, p071), both read as evidence that insurers negotiate badly. The best evidence of hospital pricing power is in the document's own footnotes, read upside down. The $382 billion excludes drug-industry extraction ($240B), deferred to a June 2026 drug inquiry (p004), and three overlapping items, to avoid double-counting. The RFI's target covers about a third of measured extraction and takes up about 98 percent of its pages.
| The three biggest omissions | Magnitude | Status |
|---|---|---|
| Hospitals and health systems — commercial prices above Medicare-equivalent rates, method shown, an independent reconstruction landing ~10 percent above it. Facility fees ($95B ANALYST), for-profit net income ($85B), nonprofit surplus ($65B) and supply-chain markup ($61B) are overlapping mechanisms | $306B ESTIMATED | ABSENT |
| Private equity — the published evidence supports no defensible national aggregate, so we assert none: a Senate Budget Committee investigation, four peer-reviewed findings, a contrary null result we raise ourselves, and a GAO finding that federal data cannot identify these owners | — | GESTURED AT |
| Medicare Advantage overpayment — MedPAC 2026 | $76B SOURCED42 | ABSENT |
It cannot be blamed on jurisdiction. Site-neutral payment, §501(r) charity-care obligations and Medicare's payment for sicker-looking patients are all Finance Committee business. ANALYST: the scope tracks what is politically safe to attack, not what costs most — hospitals are the largest employer in most Congressional districts, and the RFI recruits them as allies (p005, p060, p061).
We state the hospital case in full and concede three parts of it — the unfunded emergency-care duty, rural and safety-net solvency, unbillable standby capacity — narrowing our claim with carve-outs keyed to existing Medicare designations (4A.3a). But price moves when market structure moves and stands still when the obligation moves: mergers in concentrated markets raise prices 6 to 65 percent, and physician-service prices 14.1 percent once a hospital buys the practice SOURCED36 — while no merger changes anybody's EMTALA duty.
Squeeze one part of a company and the money moves to another part of the same company
Three escape routes: sideways into a sister company the rule does not cover, relabelling the same activity, or pushing the squeeze down the chain onto an unregulated link. The RFI states the principle itself at p077: the MLR rule "has created unintended incentives for insurers to expand into provider, PBM, and pharmacy markets" SOURCED. A rule capping margins is what built the conglomerates, and every proposal in Section 3 aims at the same legal entity that failed last time. For 34 of the 71 proposals we rated, we can name the specific place the money would move to. Hence four design principles: cover the whole company, cover the whole chain, keep rules enforceable, require disclosure before caps. The cost of ignoring the first: the RFI's central tool covers only 37 to 46 percent of the commercial market ESTIMATED. A falsifiable prediction, ANALYST: five years on, the premium share reaching care will be within ±2 points of where it started — while reported MLR rises and reported administrative costs fall.
Three things the plan gets wrong about its own subject
The RFI's own yardstick is broken, and the document says so. MLR applies only to the insurance subsidiary (p077); "quality improvement" has quietly swallowed "untargeted provider bonuses, general marketing, overhead and lobbying" (p078); capping profit as a share of revenue "may have the effect of increasing incentives for insurance companies to raise their own costs" (p077). SOURCED. A number you can move by overpaying your own subsidiary, pad by relabelling overhead, and improve by spending more is not a floor. It is a filing requirement.
AI is how the denials actually get made, and it gets seven mentions — "artificial intelligence" 7 times, "algorithm" 0, "machine learning" once in a footnote (p063) — while every procedural safeguard assumes an opponent working at human speed. Holding an automated reviewer to the same documentation and clinical standards as a human reviewer — which CMS can do by regulation, without a vote — is absent from the document and is the single best return-per-unit-of-effort item in our analysis. And there are two AIs: the same class of system runs the hospital billing office, pushing codes higher and mass-producing appeals ($14.6B of excess hospital payments in the electronic-records era, $2.3B of AI-enabled coding excess, both SOURCED, caveats at 8.6a). The RFI concedes the point in two words at p053 — "health insurers and providers are increasingly incorporating artificial intelligence" — then never returns. So write the rule symmetrically: automate a job, inherit its obligations.
The strongest attack available needs no new law, and the RFI does not make it. Insurers already breach the 90-day provider-directory rule (p056); record-keeping duties go unenforced (p058); advance cost estimates, required by Congress in 2021, were never implemented (p064); a cross-government effort since 2024 has produced no progress (p085). SOURCED. And then the document asks for new powers, when enforcement needs no vote.
Chronic illness and long COVID: zero, verified — those terms and "ME/CFS" appear 0 times; "chronic" once (p051). Patients needing many specialists continuously are continuously exposed to facility fees and consolidated-system pricing — precisely the omitted categories. An insurer-only remedy does least for those who need most.
Three measures that would actually move money back to care
Ranked by dollars moved per unit of political difficulty, allowing for gameability:
- Ban companies from marking up what they charge themselves; benchmark affiliate payments against an unrelated company's price (p076, p079). Up to 14.5 percent of money flowing between affiliates, about 4.8 percent of total revenue at the most integrated conglomerate. ESTIMATED. HARD TO DODGE. The RFI's ask: "invite comments."
- Prohibit counting the machinery of denial as "quality improvement" spending (p078). Small in direct dollars, but the keystone — it makes the headline number mean what it claims. HARD TO DODGE, by regulation alone. The RFI's ask: "invite feedback."
- Change profit and administrative caps from a share of spending to a flat fee per member (p079). $40-90B annually. ESTIMATED. PARTIAL — it removes the incentive to inflate spending, but also the insurer's reason to fight hospital price rises, so the money escapes down the chain absent a hospital-side measure.
24 of the 71 proposals are strong ideas that are hard to dodge, so we supply drafted legislative text where the Committee still asks whether rather than how: federal premium-rate authority, the MLR rewrite, the public option. The biggest missing lever within insurance is absent entirely: making wrongful denials cost money in proportion to how many get overturned, since an engine expecting to pay a fraction of a cent on the dollar will deny the claim.
One counterintuitive verdict: minimum in-network hospital requirements may worsen the lock-in in concentrated markets, stripping the insurer of its only threat to walk away. The RFI gets the structure right exactly once — Cascade Select's mandatory participation at 160 percent of Medicare (p031) — and never generalises it.
Nine components, and the one number that decides whether any of it worked
Full treatment with mechanism, dollars and enforcement: Section 12. No component is new — each is already in the RFI or this report, behind its weakest verb.
| # | Component | The point |
|---|---|---|
| 1 | Cover the whole company | Parent, subsidiaries, administrator, drug-benefit middleman, practices and billing contractor inside the boundary. Overpaying a subsidiary defeats spending floors, rate review and profit caps |
| 2 | Cover the whole chain | Hospitals inside the perimeter; they set the prices everything else is calculated from. Make the duty federal: Gobeille (577 U.S. 312 (2016)) closed the state route and is absent from the RFI |
| 3 | Disclosure before caps | Affiliate payments with the market price on the same line; internal charges transaction by transaction; reclassified "quality improvement" itemised; denials by the algorithm that decided |
| 4 | Constrain what gets taken, not just paid out | A payout cap with no capture limit pays insurers to buy more of the subsidiaries the overcharging runs through — the cure funds the disease |
| 5 | Address hospital prices | Generalise p031, add site-neutral payment ($95B), enforce §501(r) ($65B nonprofit surplus), review mergers on price |
| 6 | Hold algorithms accountable on both sides | Register the systems, report outcomes by system, hold automated decision-makers to the human standard |
| 7 | Keep it enforceable | Bright lines over vague standards, structural over procedural fixes. Automation removed the labour cost that was a complicated rule's only protection |
| 8 | Chronic illness and reachable care | Define "chronic condition" for p051, report denials by condition, count approvals each patient must obtain per year — the only measure of rationing by exhaustion |
| 9 | Medicare Advantage overpayment, $76B | Inside a government programme, and unmentioned |
The measurement standard. A reform is real only if it raises the audited group-wide care-dollar ratio by at least 5 points within five years, against a baseline a regulator has actually published — which today none has. ANALYST. Five points is demanding by design, against ±2-point annual drift. Three of the five headline measures have no baseline in existence — no US filing produces a group-wide care-dollar ratio, nobody tracks affiliate price premiums, nothing records how long patients wait — so the first deliverable of any serious plan is the measurement, not the cap, each measure carrying a named reporter, auditor, penalty and anti-gaming provision. A measure with no penalty is a press release.
How the metric gets built (12.11.1). The first two phases need no new authority and no new data collection — a proxy ratio from Medicare cost reports, MLR filings, related-party disclosure and encounter data, then a voluntary single-state filing taking the arm's-length comparator from price-transparency files already published. Only consolidated-parent filing needs statute.
How you would know it failed. Earlier signs than the five-year ratio: no published baseline within two years; thresholds raised before the subsidiary-overcharging and "quality improvement" loopholes close; hospital prices still above 254 percent of Medicare.
What to submit by October 2, and in what order
- Lead with the two independent methods that both identify hospitals as the central omission, then the coverage matrix and the $382B total. Our dollar figure can be argued with; two unrelated methods landing on the same gap cannot.
- Demand the group-wide care-dollar ratio as the measure of success, with baselines, penalties and anti-gaming provisions as drafted legislative text.
- Reframe the four hardest-to-dodge items as prerequisites, not options: no cap before measurement.
- Then the nine components, naming the missing levers as missing — cost for wrongful denials, symmetric AI rules, and something binding the links insurers do not control.
Then two things nobody else will do. Supply what the RFI asks for and cannot produce: the administrative cost patients themselves absorb (asked for at p007, measured nowhere) and the measurement of delay (no proposal captures elapsed time). And ask the hospital-price question of every remedy, including the ones we favour — the RFI's single-payer saving of "over $500 billion annually" (p038) SOURCED assumes nothing about hospital prices, and a single payer inheriting prices at 254 percent of Medicare banks the paperwork saving while paying the same inflated prices. Four gaps in our own work remain open, carrying no dollar figure: network construction, 340B arbitrage, surprise balance billing, list prices.
The thesis in one sentence: the RFI is right about insurers and will move the rest of the money rather than reduce it — unless caps come after group-wide measurement, paired with a constraint on hospital prices. A plan that does not state the number that would prove it failed is not a plan.
Note on what we verified. The $18 billion hospital denial-rework figure is byte-identical to RFI p060, and every claim of absence above was confirmed by exhaustive search across all 86 page files. The CMS, KFF, RAND, GAO and HHS hospital figures are carried from an external structured review of 30 July 2026 — Structured Analytical Review, Revised Edition, by Thomas Ferguson, produced independently of Brainworks (§4A.4c) — which states it verified them against public sources; we have not re-derived them.
1. The verdict
Senate Finance Democrats have produced the most honest description of insurance industry extraction ever published by a Congressional committee, and almost none of what they propose would stop it. By their own numbers, insurers keep roughly $1,000 per enrollee in overhead and profit (p071), and the rule built to claw that back returned about $200 per enrollee in 2024 (p077). SOURCED. That is a recovery rate near 20 percent. The Committee prints both figures six pages apart and never sets them side by side. Every place in all 86 pages where the Committee asks for drafted proposals rather than comment is a middleman item: the independent billing clearinghouse ("request specific proposals," p061), third-party-administrator oversight ("request detailed comments and analysis," p081) and repricers plus PBM-style reforms extended to TPAs ("request detailed proposals," p084). The levers that would actually move the premium dollar get the soft verb — federal rate authority ("invite feedback," p021), single payer ("invite feedback," p039) and the entire MLR rewrite ("invite comments," p077, p079). SOURCED. The Committee is ready to legislate against intermediaries and is still gathering views on the machinery that sets the price.
A word on what that contrast does and does not mean, because it is easy to over-read. A request for information invites feedback by design; that is the instrument's grammar, not a failure of nerve, and nothing here should be read as an accusation of timidity. The ask verbs are useful because they are differential, not because "invite" is weak. Within one document, on one date, from one drafting team, some items carry "request detailed proposals" and others carry "invite feedback" — and the distribution is not random. That differential tells a submitter where drafted statutory text will be useful and where the Committee has already moved past the question. We read it as a map, and this memorandum is written to it: here is the drafted proposal your process invited, aimed at the places your own verbs say are still open. Where the memorandum below reports an ask as "soft," it means softer than this document's own hardest ask, and nothing more.
This is the Democratic healthcare proposal, and it is an insurance document. The RFI names itself successor to the Committee's 2008 "Call to Action," the paper that preceded the ACA (p002), which makes it the text the next Democratic health reform will be drafted from. It sets its own standard on page 4 — reforms "that require every industry in the health care sector to provide constructive solutions" (p004) — and then spends almost all 86 pages on health insurers: their denials, their MLR, their buybacks, their vertical integration, their administrative overhead. Measured against our own extraction taxonomy, the RFI's perimeter covers 24 to 32 percent of measured extraction ESTIMATED and leaves $382 billion a year ESTIMATED in named, quantified extraction either missing from the document entirely or gestured at without a mechanism. The biggest single absence is hospital and health-system extraction at $306 billion ESTIMATED, which appears nowhere as a diagnosed problem: "facility fee," "site of service," "provider consolidation," "market power," "monopoly," "antitrust," "nonprofit" and "charity care" each appear zero times, and none of the four occurrences of "consolidation" refers to hospital or physician-practice consolidation — two are explicitly insurer-scoped, one names insurers as the acquiring party, and one is unqualified market-level (4A.3). Section 4A measures this; Exhibit 6 tabulates it. Mistake one actor for the system and you get remedies that squeeze insurer margin while the rest of the machine runs undisturbed. The share of the premium dollar that reaches care need not move at all.
Two independent methods reach that conclusion, and that is the strongest thing in this report. We reached it by accounting: build the extraction taxonomy first, test the RFI against it, and hospitals come out as the largest unaddressed channel. A separate structured analytical review dated 30 July 2026, by Thomas Ferguson, produced independently of Brainworks (named and described at 4A.4c), reached it by competing-hypotheses testing against public CMS, KFF, RAND, GAO and HHS data, using none of our figures, and found the hospital omission to be the single largest blind spot in the RFI. Hospital care is about $1.6 trillion, roughly 31 percent of national health spending, and about 40 percent of all spending growth from 2022 to 2024. Commercial plans pay hospitals 254 percent of Medicare rates. SOURCED3, per Exhibit 5. The insurer-conduct reforms in the RFI govern how those dollars get fought over. The hospital price decides how many dollars there are to fight over, and nothing in 86 pages touches it. Sections 4A.4a through 4A.4c carry the mechanism, the structural reason for the omission, and the corroboration.
Inside that frame, the document is remarkable. It correctly identifies that denial and delay are revenue strategies (p059), that the Medical Loss Ratio is gamed through affiliate transfer pricing (p077), that utilization management is booked as quality improvement (p078), that intercompany eliminations account for approximately one third of UnitedHealth Group's 2025 revenue (p075), that administrative-services-only profits run nearly five times fully-insured profits (p080), and that existing law is not being enforced (p058). Having laid out a structural indictment, it attaches its softest verbs to the reforms that would close those channels — which, in an RFI, is an invitation to supply the missing draft rather than a refusal to act. This memorandum takes it as one.
Read the RFI's ask verbs and a specific pattern appears: the Committee asks hardest where it is going after the self-insured middleman layer, and softest where it would move the most money. The three hardest asks in the document all land on middlemen. At p081 it writes "Senate Democrats request detailed comments and analysis on the following topics and concepts:" and governs the TPA oversight cluster with it. At p084 it writes "We request detailed proposals and feedback on the following topics and concepts:" over repricers, revenue-cycle management and the extension of PBM reforms to TPAs. At p061 it writes "We invite comments and feedback on this approach and request specific proposals on the type of entity that should own and operate such a clearinghouse." That is the RFI's only request for specific proposals on institutional design, and it is spent well.
Now the other side. Federal authority to cap, reduce or reject unjustified rates gets "Senate Democrats invite feedback on approaches to establishing an enhanced uniform federal rate review standard" (p021). The entire rate-review cluster across p019 to p021 carries nothing but "invite." The federal public option gets "request feedback on approaches to financing" (p035) — feedback on financing, not proposals on design. Single payer gets "Senate Democrats invite feedback on the establishment of and transition to a single payer system" (p039). Every MLR reform in Section 3 — including disallowing internal markups and converting profit caps off percentage-of-spend — sits under "Senate Democrats invite comments on approaches to modernize and strengthen MLR rules" (p079). Raising MLR thresholds gets "We invite feedback on this approach, along with detailed proposals" (p079): the hard noun, the soft verb.
So the asymmetry is real but it is not the one a reader would guess, and it is a statement about readiness rather than about courage. It does not run structural-versus-procedural. It runs middleman-versus-money. The Committee has decided the TPA and repricer layer is where it is prepared to legislate, and it is asking for drafting-grade input there. On rate authority, the public option, single payer and the MLR rewrite — the four levers that would actually move the share of the premium dollar reaching care — it is still asking whether to proceed. Those are the places where a submission can still change the shape of the ask.
Three findings dominate within the insurance perimeter. Each is a symptom of the framing problem rather than a separate complaint: a broken metric, an unexamined mechanism, and an unused enforcement path all follow from scoping a system down to one of its actors.
First, the RFI's own yardstick is broken, and it says so without drawing the conclusion. MLR is the implicit success measure across the document. The RFI states that MLR applies only to the insurance entity rather than the parent (p077), that quality-improvement classification has swallowed "untargeted provider bonuses, general marketing, overhead and lobbying" (p078), and that regulating profit as a percentage of revenue "may have the effect of increasing incentives for insurance companies to raise their own costs" (p077). A number that can be moved by transfer pricing, padded by relabelling, and raised by spending more is not a floor. It is a filing requirement. In 2024 MLR returned approximately $200 per enrollee (p077) against approximately $1,000 per enrollee captured in overhead and profit (p071) — a recovery rate near 20 percent. We propose the care-dollar ratio as the replacement and specify it in Section 3.
Second, the RFI treats automated adjudication as a footnote when it is the mechanism. Across 86 pages, "artificial intelligence" appears seven times, five of them in body text on four pages (p049, p052, p053, p054 twice); "algorithm" appears zero times; "machine learning" appears once, in a footnote citing the National Association of Insurance Commissioners' own 2025 survey of insurer AI use (p063, fn 266). The RFI holds the pointer to the regulatory inventory of payer AI and asks nothing about it. Its only direct question on automation is addressed to insurers, and answering is voluntary (p054). This matters because every procedural safeguard the RFI proposes assumes an adversary working at human speed. A 19 percent denial rate on 85 million claims with "other" as the most common stated reason (p055), against a 0.2 percent patient appeal rate (p057, 2021 Marketplace data; 0.3 percent in 2024), is not a process failure. It is a process running as designed, and automation drives the cost of running it toward zero.
Third, the strongest attack available needs no new statute, and the RFI does not make it. The document reports that plans break the existing 90-day directory-accuracy requirement (p056), that ERISA record-production obligations go unenforced and the Department of Labor is not enforcing them (p058), that advance explanations of benefits mandated in 2021 were never implemented (p064), and that a cross-government inquiry begun in 2024 has produced no progress (p085). It then asks for new authorities. In each of the four cases the obligation already exists in law, so the remedy is enforcement capacity rather than new authority.
And a fourth finding sits underneath the other three: regulate margin and the money does not disappear, it moves. Cap profit at one point in the chain and integrated and adjacent actors take the same profit somewhere else — vertically, in an affiliate outside the rule; horizontally, by relabelling the activity; or across the chain, in a link nobody regulates. We call this the waterbed principle and develop it in Section 4B. We can name where the money would go for 34 of the RFI's 71 rated proposals (Exhibit 7). Only four survive the test — affiliate benchmarking at service level (p075-p079), disallowing internal markups (p079), barring utilization management from quality-improvement classification (p078), and the presumptive-approval and automatic-external-review pair (p052, p058) — and three of those four carry the document's softest asks. The RFI supplies the principle's own proof at p077: MLR "applies only to the insurance entity rather than the parent company, which has created unintended incentives for insurers to expand into provider, PBM, and pharmacy markets." A margin rule is what built the conglomerates. The document reports that as history and never asks what its own new caps would build. Every item in Section 3 is scoped to the same single entity.
So what? Do not argue the RFI is wrong. Argue that it is right, that it does not act on what it found, and that it is aimed at one actor in a system with several: hand the Committee the coverage matrix naming the $382 billion outside its perimeter, hand it the three quantifications it asks for and cannot produce, insist the success metric is the consolidated-group care-dollar ratio and not insurer margin, and supply for the four relocation-resistant items the drafted statutory text, with the derivation attached, that the "invite feedback" ask is asking for.
2. Three questions to ask of every proposal
Every proposal in Section 8 of this report is rated on three independent axes: does it move money back to care, does it get patients treated, and how fast can the industry work around it. The three answers routinely disagree with each other, and where they disagree is where the finding is.
2.1 Axis 1 — Care-dollar ratio
Definition. The care-dollar ratio is the share of every dollar entering the health financing system that is received by a clinician, facility, pharmacy or supplier as payment for a delivered service, measured at the level of the consolidated corporate parent and all affiliates, with affiliate payments valued at the price an unaffiliated party would have received for the same service.
- Numerator: payments for delivered care, valued at arm's-length equivalent prices. Affiliate payments are re-priced to the unaffiliated benchmark; the differential is reclassified out of the numerator.
- Denominator: all dollars entering the system attributable to the covered population — premiums, employer contributions, employee contributions, federal subsidies and tax expenditures, patient cost-sharing, and any fees collected from providers or plan sponsors by affiliated entities.
- Rebates, kickbacks and every other retrospective transfer: all consideration flowing back to the covered entity or any affiliate after the initial payment — manufacturer rebates, administrative and data fees, formulary placement payments, GPO administrative fees, distributor chargebacks, purchasing and volume discounts, 340B spread capture, and any payment travelling under a label other than "rebate" — must be reported and deducted from the numerator, irrespective of which corporate entity receives them or how they are characterised. A dollar that leaves as a payment for care and returns as a rebate was never a care dollar.
Why retrospective transfers have to be named explicitly. This is the single largest avenue for restating profit as care spending, and it works because the money moves twice. The gross payment enters the numerator; the return leg lands in an affiliate that is not the reporting entity, under a name that is not "profit." Both halves are individually defensible and the combination is invisible. The RFI itself supplies the evidence that this is not hypothetical: it proposes "pass-through of rebates" for TPAs and ASO arrangements (p080-p084), which concedes that rebates are currently not passed through. But it treats this as a plumbing question inside pharmacy benefit management rather than as a general accounting rule, so the same manoeuvre remains available everywhere else. Any ratio that measures gross payments and ignores the return leg can be satisfied without a single additional dollar reaching a clinician. The definitional requirement is net-of-all-consideration reporting, with the burden of disclosure on the entity, not the regulator.
Three ways this diverges from MLR, each of which the RFI itself documents:
| MLR (45 CFR Part 158) | Care-dollar ratio | |
|---|---|---|
| Reporting entity | The licensed insurance entity only (p077) | Consolidated parent and all affiliates |
| Numerator | Claims paid plus quality-improvement activities, which have included "untargeted provider bonuses, general marketing, overhead and lobbying" (p078) | Delivered care only, at arm's-length prices |
| Affiliate transfers | Counted at the transfer price the conglomerate chooses; UnitedHealth is reported to pay its own physician groups 17 percent more than outside ones (p073, fn 319) | Re-priced to benchmark; differential excluded |
| Denominator | Premium revenue of the regulated entity | All dollars in, including cost-sharing, subsidies, and affiliate fee income |
| Self-insured market | Largely outside MLR — over 60 percent of the insured (p062, p079) | Included |
Why the distinction decides everything. Under MLR, a conglomerate that pays its own subsidiary 17 percent above market books a larger numerator, a higher MLR, a smaller rebate bill, and keeps the 17 percent as profit in an affiliate nobody regulates. One move defeats MLR floors, rate review and profit caps at the same time, because all three are keyed to the insurance entity. The RFI describes this mechanism precisely at p075 to p077. Its fix — "limiting the share of transfers and eliminations that can be reported as medical spending" (p076) — is a bullet point under "we request feedback."
Ratings: STRONGLY POSITIVE / MARGINAL / NEUTRAL / NEGATIVE / INDETERMINATE.
2.2 Axis 2 — Accessibility and affordability, nominal versus effective
Nominal access is coverage on paper: an enrollment record, a benefit in the plan document, a specialist on the directory. Effective access is a patient receiving indicated care, within the clinically relevant window, at a cost they can actually bear, without expending resources they do not have.
The ghost-network problem is wider than the directory error, and the wider part is lawful. Public discussion of ghost networks has settled on directory inaccuracy — the listed physician who has moved, retired, died, or was never contracted. That framing understates the problem by treating it as a records-maintenance failure. A directory can be perfectly accurate and the network still deliver no care. Three populations must be counted as unavailable, and only the first is currently measured:
- Listed but not contracted — the classical directory error. Measured, litigated, and the only one the RFI addresses (p048).
- Contracted but closed to new patients. A physician who accepts no new patients is not a source of care for any enrollee who does not already have them. They nonetheless count toward network adequacy in every jurisdiction we are aware of. This is not an error in the directory; the entry is true. It is an error in what the standard counts.
- Contracted, open, but unavailable within the clinically relevant window. An appointment offered in eleven months is not access to care for a patient who needs a diagnosis now. Whether it is effectively a denial depends on the condition, not on the calendar — which is precisely why the standard must be clinically indexed rather than a single fixed interval.
Categories 2 and 3 are the larger share of the problem and neither requires anyone to publish anything false. An adequacy standard counting roster membership rather than obtainable appointments can be satisfied in full while delivering nothing, and a plan managing to that standard has no reason to contract beyond it. The measurement error and the incentive are the same object.
The consequence for this report's accounting: network adequacy must be measured as realised availability — whether a patient can actually obtain an appointment within the window their condition requires — and not as the count of names on a list. Section 12.10 sets out the measurement and enforcement that follow, including secret-shopper auditing and penalties indexed to realised wait times; Section 4A.7 states the qualification that any adequacy floor needs a paired rate ceiling in concentrated markets, which applies to an availability standard exactly as it does to a roster one.
The RFI writes its own effective-access standard at p014 — "every American is not only covered, but can access, afford and receive care when they need it" — and then proposes almost entirely against the nominal layer. Where it does touch effective access, it is usually quoting someone else. The sharpest instance: the only passage in 86 pages that names appointment wait times and specialist availability as harms is a summary of a federal court's stay of the 2027 Notice of Benefit and Payment Parameters (p047). It is not a Committee proposal.
The RFI's own evidence that nominal coverage is failing effectively:
| Finding | Page | Layer |
|---|---|---|
| Over 100 million Americans with medical debt, including more than 4 in 10 people with insurance | p011 | Nominal coverage, no effective affordability |
| Nearly half of insured people received a bill for a service they expected to be covered | p011 | Nominal benefit, no effective benefit |
| Nearly 40 percent of insured people delayed or skipped care they could not afford | p011 | Nominal access, no effective access |
| About half of insured people lack the resources to meet their deductible | p022 | Nominal benefit unreachable |
| Out-of-pocket maxima "de facto unreachable for millions" | p025 | Nominal protection |
| Ghost networks: directories listing providers not actually in network | p048 | Nominal network |
| No Surprises Act holds patients harmless on cost but leaves them "navigating coverage with a misleading network" | p048 | Fixes the bill, not the access |
| Employer coverage "considered affordable under existing law, but is not affordable in practice" | p029 | The RFI's own words |
The affordability test applied in this report goes beyond premium to: deductible, coinsurance, out-of-pocket maximum reachability, the uncovered-service gap, balance billing, and the cost of contesting a denial — which the RFI quantifies only from the provider side (14 hours per week on 45 prior authorizations, p049) and never from the patient side.
Ratings: IMPROVES / WORSENS / UNCHANGED / INDETERMINATE.
2.3 Axis 3 — Gameability
Definition. The speed and completeness with which a regulated party can preserve its economic position while nominally complying. Rated HIGH, MEDIUM or LOW. Where not LOW, the vector is named concretely: which entity, which accounting or operational move, which definitional boundary, and approximately how long to production.
A proposal scoring STRONGLY POSITIVE on Axis 1 and HIGH on Axis 3 is not a good proposal. A rule that can be worked around does not redirect a dollar, however large the dollars it aims at. This report weighs ungameability equally with size of effect.
Gameability and AI-durability are two views of the same property. Brailer's application of the Ng conditions explains why. AI deployment scales and compounds where three conditions hold: large volumes of structured labeled data, human-in-the-loop correction, and — decisively — an outcome signal that is "observable quickly, unambiguously, and in direct connection to the action being taken." Revenue-cycle management satisfies all three: "the claim pays or it does not." Cost management and utilization reduction satisfy none, so, in Brailer's phrase, "the circle does not turn."
Applied to regulation, this yields a design rule:
A rule whose compliance signal is binary, immediate and internal to the firm will be optimised against at machine speed. A rule whose compliance signal is qualitative, delayed and external will not be complied with at all.
Every process-addition remedy in the RFI creates the first kind of signal — a fast, internal, binary pass/fail that a claims system can be tuned against. That is why the gameability ratings in this report cluster HIGH around procedural fixes and LOW around flipping the default.
The nine vectors used in the ratings: definitional gaming; affiliate and intercompany transfer; reclassification; network construction; benefit design; timing and reporting-period manipulation; threshold gaming just under a regulatory trigger; burden-shifting onto patient or provider where it becomes invisible to the regulator; and contractual suppression of audit rights.
So what? Score the RFI on all three axes and the proposals it pushes hardest and the proposals that would actually work turn out to be two nearly separate lists. The Committee is leaning on the wrong items, and the scorecard shows which ones.
3. Exhibits
Exhibits 1 through 4 appear here. Exhibit 5 (the hospital price base) appears in Section 4A.4a, Exhibit 6 (the coverage matrix) in Section 4A.5, Exhibit 7 (the relocation register) in Section 4B.4, Exhibit 8 (the disability discontinuity in the federal labour data) in Section 9.2a.1, and Exhibits 9 and 10 (the headline metrics with their baselines and penalties, and the anti-gaming register) in Section 12.11, because each is only readable alongside the argument that constructs it.
A note on section numbering. Sections 4A and 4B carry letters rather than numbers of their own, so the order reads 1, 2, 3, 4A, 4B, 4, 5, … 11, 12. Section 12 sets out what a plan with real, measurable, enforceable impact requires, and closes the report.
Exhibit 1 — Three-axis scorecard
Ask-strength codes are read from the RFI's own verbs, re-derived 2026-07-30 by locating the governing ask sentence on the cited page for every row and quoting it verbatim. Code boundaries, keyed to the exact verb constructions present in the document:
What these codes are for, stated before they are used. A request for information invites comment by design. "Invite feedback" is the instrument's ordinary register and carries no implication of evasion or reluctance; treating it as one would be a category error about the genre, and we do not make it. The codes are worth recording only because they are differential within a single document — the same drafters, on the same day, chose "request detailed proposals" for some items and "invite feedback" for others, and that choice is informative about where drafting has already begun. Read the codes as a map of where a submission's finished text will be most useful, not as a scoring of the Committee's resolve.
| Code | Verb constructions that trigger it | Instances in document |
|---|---|---|
| RP | "request specific proposals" · "request detailed proposals" · "request detailed comments and analysis" | 3 (p061, p081, p084) |
| RF | "request feedback" · "request comments" · "request specific feedback" · "request analysis" · "seek feedback" · "seek comments" | 24 |
| IF | "invite detailed proposals" · "invite comments" · "invite feedback" · "invite analysis" · "invite proposals" · "are interested in feedback" | 40 |
| W | "welcome" | 4 (p023, p032, p033, p074) |
Three rules applied. (1) Where a bulleted list of proposals sits under one umbrella ask sentence, every bullet inherits the umbrella verb — this governs 2.3–2.10 under p051, 3.7–3.10 under p077, 3.11–3.15 under p079, and 3.17–3.19 under p081. (2) Where an item carries mixed language, it is coded to the weaker verb with both quoted in a footnote. (3) Where no explicit ask sentence governs a proposal, it is coded UNSTATED rather than guessed.
All 71 rows are coded against source text, verified individually. The distribution that results is set out in the note below the table.
| # | Proposal | Page | Ask | Axis 1 Care-dollar | Axis 2 Access/afford | Axis 3 Gameability |
|---|---|---|---|---|---|---|
| SECTION 1 | ||||||
| 1.1 | Restore navigator funding, impartial enrollment assistance | p014-015 | IF | MARGINAL | IMPROVES | LOW |
| 1.2 | Unified/centralized enrollment platform | p016 | IF | MARGINAL | IMPROVES | LOW |
| 1.3 | Strengthen essential health benefits | p018 | IF | NEUTRAL | IMPROVES | MEDIUM |
| 1.4 | Affordability standard based on total annual cost exposure, not premium alone | p018 | RF | NEUTRAL | IMPROVES | MEDIUM |
| 1.5 | High-value care before deductible with no cost-sharing | p018-019 | IF | MARGINAL | IMPROVES | MEDIUM |
| 1.6 | Enhanced rate review: require justification of administrative cost growth and utilization management | p020 | IF | STRONGLY POSITIVE | IMPROVES | MEDIUM |
| 1.7 | Federal authority to cap, reduce or reject unjustified rates | p020-021 | IF | STRONGLY POSITIVE | INDETERMINATE | MEDIUM |
| 1.8 | Capped rate increases at flat rate or medical trend | p021 | IF | INDETERMINATE | INDETERMINATE | HIGH |
| 1.9 | Eliminate or cap deductibles on non-shoppable services | p023-024 | RF [^a1] | NEUTRAL | IMPROVES | MEDIUM |
| 1.10 | Prohibit or limit coinsurance as a utilization management tool | p024 | RF | MARGINAL | IMPROVES | MEDIUM |
| 1.11 | Reduce statutory out-of-pocket maximum; income-based caps | p025 | RF | NEUTRAL | IMPROVES | MEDIUM |
| 1.12 | Commercial-market oversight entity (MedPAC analogue) | p029-030 | RF | STRONGLY POSITIVE (enabling) | INDETERMINATE | LOW |
| 1.13 | Eliminate the ACA employer-coverage firewall | p029 | RF | NEUTRAL | IMPROVES | MEDIUM |
| 1.14 | State public options via 1332; Nevada, Colorado, Washington | p030-031 | RF | MARGINAL | INDETERMINATE | MEDIUM |
| 1.15 | Federal public option (Medicare-X; Affordable CHOICE Act) | p033-036 | RF | STRONGLY POSITIVE | IMPROVES | MEDIUM |
| 1.16 | Medicare buy-in / Part E (Choose Medicare Act, S.2032) | p036-037 | RF | STRONGLY POSITIVE | IMPROVES | MEDIUM |
| 1.17 | Medicaid buy-in (State Public Option Act, S.2073) | p037 | RF | STRONGLY POSITIVE | IMPROVES | MEDIUM |
| 1.18 | Single payer (Medicare for All Act, S.1506) | p038-039 | IF | STRONGLY POSITIVE | IMPROVES | LOW |
| 1.19 | Prohibit junk plans (No Junk Plans Act, S.942) | p041 | RF | MARGINAL | IMPROVES | MEDIUM |
| 1.20 | Deny federal support to issuers marketing junk coverage | p041 | IF | MARGINAL | IMPROVES | LOW |
| 1.21 | Restore premium tax credit recapture caps (S.3368) | p042 | IF | NEUTRAL | IMPROVES | LOW |
| SECTION 2 | ||||||
| 2.1 | Codify and expand standardized plan designs | p046-047 | RF | MARGINAL | IMPROVES | MEDIUM |
| 2.2 | Network adequacy federal floor; ghost-network penalties; remove repeat offenders | p047-048 | RF | NEUTRAL | IMPROVES nominal / INDETERMINATE effective in concentrated provider markets — see 4A.7 | HIGH |
| 2.3 | Prior authorization: gold carding | p051 | RF | MARGINAL | IMPROVES | HIGH |
| 2.4 | Prior authorization: limits or bans for defined circumstances incl. chronic conditions | p051 | RF | MARGINAL | IMPROVES | HIGH |
| 2.5 | Neutral third-party evaluators replacing plan-run prior authorization | p051 | RF | STRONGLY POSITIVE | IMPROVES | MEDIUM |
| 2.6 | Reviewer qualification: board-certified, same-specialty, named | p052 | RF | NEUTRAL | IMPROVES | MEDIUM |
| 2.7 | Presumptive approval of in-network care; burden shifted to the plan | p052 | RF | STRONGLY POSITIVE | IMPROVES | LOW |
| 2.8 | Standardized prior authorization forms, codes and processes | p052 | RF | MARGINAL | IMPROVES | MEDIUM |
| 2.9 | Presumptive approval on timeout, with escalating penalties for clock gaming | p053 | RF | MARGINAL | IMPROVES | LOW |
| 2.10 | Codify the 2025 voluntary industry prior-authorization pledge | p053-054 | RF | NEUTRAL | INDETERMINATE | HIGH |
| 2.11 | Expand denial-data reporting across all private markets, made research-usable | p055 | IF | NEUTRAL (enabling) | UNCHANGED | MEDIUM |
| 2.12 | Plain-language standardized denial notices | p055, p058 | IF | NEUTRAL | IMPROVES | MEDIUM |
| 2.13 | Independent claims adjudication entity; remove plans from medical-necessity determinations | p056, p059 | RF | STRONGLY POSITIVE | IMPROVES | LOW |
| 2.14 | Mid-year change protections; extend continuity to 180 days or end of treatment | p056 | IF | MARGINAL | IMPROVES | MEDIUM |
| 2.15 | Automatic external review without patient initiation | p058 | IF | STRONGLY POSITIVE | IMPROVES | LOW |
| 2.16 | Penalties and corrective action keyed to denial and overturn rates | p058 | IF | STRONGLY POSITIVE | IMPROVES | MEDIUM |
| 2.17 | Prompt payment plus single consolidated patient invoice | p061 | RF | MARGINAL | IMPROVES | MEDIUM |
| 2.18 | Direct contracting between employers and providers | p061 | IF | MARGINAL | INDETERMINATE | MEDIUM |
| 2.19 | Independent billing and coding clearinghouse | p061 | RP | STRONGLY POSITIVE | IMPROVES | LOW |
| 2.20 | Extend consumer protections into the self-insured market; state waiver authority | p062-063 | IF | MARGINAL | IMPROVES | MEDIUM |
| 2.21 | Consumer access to own claims and decision records | p063-064 | IF | NEUTRAL (enabling) | IMPROVES | MEDIUM |
| 2.22 | Private right of action against plans across private markets | p065 | IF | STRONGLY POSITIVE | IMPROVES | LOW |
| 2.23 | Fiduciary duties and standards of review for plans and TPAs making medical-necessity determinations | p065, p081 | IF/RP | STRONGLY POSITIVE | IMPROVES | MEDIUM |
| 2.24 | Consequential damages for improper denials beyond the claim amount | p065 | IF | STRONGLY POSITIVE | IMPROVES | LOW |
| 2.25 | Permanent mandatory HCFAC funding for private-market oversight | p067 | RF | MARGINAL (enabling) | INDETERMINATE | LOW |
| 2.26 | Restore auto re-enrollment, special enrollment periods, presumptive eligibility | p067-068 | IF | NEUTRAL | IMPROVES | LOW |
| SECTION 3 | ||||||
| 3.1 | Limit stock buybacks, executive compensation, non-health-care investment of taxpayer dollars | p072 | RF | MARGINAL | UNCHANGED | HIGH |
| 3.2 | Private equity restrictions, ownership database, Oregon-style corporate-practice limits | p072-073 | IF | MARGINAL | INDETERMINATE | MEDIUM |
| 3.3 | Vertical integration oversight: ownership and financial-relationship reporting | p074-075 | W | NEUTRAL (enabling) | UNCHANGED | MEDIUM |
| 3.4 | Benchmark affiliate payment rates to unaffiliated rates | p075, p076, p079, p082, p084 | RF | STRONGLY POSITIVE | UNCHANGED | LOW |
| 3.5 | Break up conglomerates (S.3822; S.2836) | p075 | IF | STRONGLY POSITIVE | INDETERMINATE | MEDIUM |
| 3.6 | Limit the share of intercompany transfers reportable as medical spending | p076 | RF | STRONGLY POSITIVE | UNCHANGED | MEDIUM |
| 3.7 | MLR routine audit authority with penalties for non-compliance | p077 | IF | STRONGLY POSITIVE | UNCHANGED | LOW |
| 3.8 | MLR line-item disclosure: affiliate vs non-affiliate, QIA, overhead | p077 | IF | STRONGLY POSITIVE (enabling) | UNCHANGED | LOW |
| 3.9 | Prohibit classifying utilization management as quality improvement | p078 | IF | STRONGLY POSITIVE | IMPROVES | LOW |
| 3.10 | Bar late-plan-year QIA loading; independent outcomes-based QIA classification | p078 | IF | STRONGLY POSITIVE | UNCHANGED | LOW |
| 3.11 | Convert profit and administrative caps from percentage-of-spend to fee-per-member tied to a growth rate | p079 | IF | STRONGLY POSITIVE | INDETERMINATE | LOW |
| 3.12 | Flat percentage-of-revenue profit cap | p079 | IF | STRONGLY POSITIVE | INDETERMINATE | MEDIUM |
| 3.13 | Disallow internal price markups from MLR; benchmark related-party transactions | p079 | IF | STRONGLY POSITIVE | UNCHANGED | LOW |
| 3.14 | Escalating MLR penalties incl. loss of federal subsidy eligibility or market participation | p079 | IF | STRONGLY POSITIVE | INDETERMINATE | LOW |
| 3.15 | Extend MLR to self-insured plans and TPA/ASO contracts | p079, p082 | IF | STRONGLY POSITIVE | UNCHANGED | MEDIUM |
| 3.16 | Raise or reformulate MLR thresholds | p079 | IF [^a2] | STRONGLY POSITIVE | INDETERMINATE | HIGH |
| 3.17 | TPA and ASO contracts limited to per-member-per-month fee structure | p081-082 | RP [^a3] | STRONGLY POSITIVE | UNCHANGED | LOW |
| 3.18 | TPA transparency and guaranteed plan-sponsor access to claims and cost data | p081-082 | RP [^a3] | NEUTRAL (enabling) | UNCHANGED | HIGH |
| 3.19 | Require TPAs to pass savings, rebates and shared-savings revenue to plan sponsors | p081-083 | RP [^a3] | STRONGLY POSITIVE | UNCHANGED | MEDIUM |
| 3.20 | Independent conflict-free TPAs; leverage Medicare administrative contractors | p083 | IF | STRONGLY POSITIVE | IMPROVES | LOW |
| 3.21 | Repricer and revenue-cycle-management reform; pass spread-pricing profit to sponsors | p083-084 | RP | STRONGLY POSITIVE | IMPROVES | MEDIUM |
| 3.22 | Apply bipartisan PBM reforms to TPAs and affiliates | p084 | RP | STRONGLY POSITIVE | UNCHANGED | MEDIUM |
| 3.23 | System-wide transparency; centralized public data; all-payer claims databases | p085-086 | IF | NEUTRAL (enabling) | UNCHANGED | HIGH |
| 3.24 | Interagency capacity and coordination for HHS, CMS, DOL, DOJ | p085 | IF | MARGINAL (enabling) | UNCHANGED | LOW |
Two things the scorecard shows at a glance.
First: every one of the RFI's hardest asks lands on the middleman layer. The RP code appears on seven rows — 2.19, 2.23, 3.17, 3.18, 3.19, 3.21, 3.22 — and it is generated by exactly three sentences in the document: "We invite comments and feedback on this approach and request specific proposals on the type of entity that should own and operate such a clearinghouse" (p061); "Senate Democrats request detailed comments and analysis on the following topics and concepts:" governing TPA oversight (p081); and "We request detailed proposals and feedback on the following topics and concepts:" governing repricers, revenue-cycle management and PBM-style reforms applied to TPAs (p084). Not one is enrollment plumbing. All three go after the self-insured intermediary layer. On its own chosen ground the Committee is asking for drafting-grade material, and a submission should give it exactly that.
Second: the levers that would move the most money carry the softest verbs. Federal authority to cap, reduce or reject unjustified rates (1.7) is "invite feedback" (p021). Single payer (1.18) is "invite feedback" (p039). Every MLR reform in Section 3 — 3.7 through 3.16, including disallowing internal markups (3.13) and converting profit caps off percentage-of-spend (3.11) — sits under "invite" umbrellas at p077 and p079. The four items that raise the care-dollar ratio most and resist relocation — 3.9, 3.11, 3.13 and now 3.17 — split three IF to one RP, and the single RP among them (3.17, the TPA per-member-per-month fee structure) is the one the Committee reached only because it arrived there through the middleman door.
So what? The asymmetry is not structural-versus-procedural. It is middleman-versus-money. The Committee will legislate on TPAs and repricers and is asking how; on rate authority, the public option and the MLR rewrite it is still asking whether. Neither register is a fault — an RFI is built to ask both kinds of question, and the codes here measure only which kind each item got. A submission that wants to change outcomes should bring finished statutory text to the second list, not the first — the first is already moving.
Of 71 rated proposals, 24 rate STRONGLY POSITIVE on Axis 1 and LOW or MEDIUM on Axis 3. The good material is already in the document. Most of it is still filed under "invite."
[^a1]: Mixed language, coded to the weaker verb. p023: "Senate Democrats request feedback on the application of deductibles to non-shoppable services, and welcome proposals that prioritize consumer access and affordability." p024 adds "Senate Democrats invite comments on proposals to eliminate, limit or cap deductibles."
[^a2]: Canonical mixed-language case. p079: "We invite feedback on this approach, along with detailed proposals for specific adjustments that appropriately limit insurance company profiteering and gaming." The noun is the document's hardest; the verb is its softest. Coded IF under rule (2): reading this row as RP on the strength of the noun alone would mistake the subject matter for the ask.
[^a3]: Rows 3.17–3.19 have no ask verb of their own. The subheads "Transparency for plan sponsors," "Payment rates" and "Profits" (p082) all sit beneath the p081 umbrella: "Senate Democrats request detailed comments and analysis on the following topics and concepts:". They inherit RP under rule (1). The consequence matters: the TPA fee-structure reform is not a soft ask.
Exhibit 2 — AI-durability matrix
A remedy is AI-durable if automating the payer's response does not defeat it. The test is whether the remedy changes the outcome signal the denial engine optimises against.
| Remedy | Outcome signal after the remedy | Durable? |
|---|---|---|
| Presumptive approval of in-network care (2.7, p052) | Plan must affirmatively demonstrate safety issue or lack of necessity; silence pays the claim | DURABLE. Inverts the default. Automation cannot exploit patient inaction because inaction now favours the patient |
| Automatic external review (2.15, p058) | Every denial is reviewed by an external body regardless of patient action | DURABLE. Destroys attrition economics; 0.2 percent becomes 100 percent |
| Independent adjudication entity (2.13, p056) | Medical necessity determined by a party with no financial interest | DURABLE. Removes the signal from the interested party entirely |
| Approval on timeout (2.9, p053) | Clock expiry pays the claim | DURABLE, conditional on the clock being un-resettable. The RFI names the clock-reset vector at p053 and p060 |
| Financial liability for overturned denials (2.24, p065) | Wrongful denial carries consequential cost | DURABLE. Changes expected value of a denial from positive to uncertain |
| Penalties scaled to denial and overturn rates (2.16, p058) | Aggregate denial behaviour becomes costly | PARTIALLY DURABLE. Invites threshold gaming just under the trigger |
| Bar utilization management from QIA (3.9, p078) | UM spend can no longer be booked toward the MLR numerator | DURABLE on the accounting channel; does not by itself reduce UM volume |
| Reviewer qualification requirements (2.6, p052) | Requires a credentialed human in the loop | WEAK. Satisfiable by a credentialed signatory ratifying machine output at volume |
| Standardized forms and electronic prior authorization (2.8, p052-053) | Faster submission; determination logic unchanged | NOT DURABLE. Reduces friction for the payer more than for the provider |
| Gold carding (2.3, p051) | Exemption keyed to historical approval rate | NOT DURABLE. Payer controls both the threshold and the approval rate that determines qualification |
| Plain-language notices (2.12, p055) | Denial explained more clearly | NOT DURABLE. Generating fluent justifications at scale is precisely what these systems now do |
| Codifying the voluntary pledge (2.10, p053-054) | Self-reported volume reduction | NOT DURABLE. Metric is chosen and measured by the regulated party |
| Denial-data reporting (2.11, p055) | Reporting obligation, categories self-selected | NOT DURABLE as specified. "Other" is already the most common stated reason (p055) |
So what? Five remedies in the RFI would survive an automated payer. All five sit in Section 2, not one of them gets the document's strongest ask, and not one is linked in the text to the automation discussion three pages earlier. The Committee found the five that work and buried them.
Exhibit 3 — Transparency-precondition register
For each remedy, the data that must exist before it can be enforced, and whether it exists.
| Remedy | Data required | Exists? | Missing element |
|---|---|---|---|
| MLR floor, honestly applied (3.7, 3.8) | Affiliate versus non-affiliate payments, line-item, per legal entity, with arm's-length comparator | NO | The RFI concedes: "Regulators have little visibility into internal pricing flows... limited public data on internal pricing and affiliate markups" (p077) |
| Affiliate benchmarking (3.4, 3.13) | Service-level unit prices for affiliated and unaffiliated providers, matched by code, geography, site of service | NO | Only aggregate evidence exists — the 17 percent differential (p073, fn 319) |
| Cap on transfers reportable as medical spend (3.6) | Full intercompany transfer ledger by counterparty and service | NO | "Financial flows within insurance conglomerates often remain opaque even when ownership is disclosed" (p074) |
| Rate review of administrative cost growth and UM (1.6) | Administrative cost by function; UM volume, cost, denial and overturn rates by service line, filed with rate submissions | NO | The RFI states plans are "rarely required... to meaningfully demonstrate" cost justification (p019) |
| Bar UM from QIA (3.9) | QIA spend itemised by activity with effectiveness evidence | NO | Current classifications are "vague," reaching "hundreds of millions of dollars each year" (p078) |
| Profit and buyback limits (3.1) | Consolidated segment-level margin attribution across all affiliates | PARTIAL | Securities filings give segment revenue, not care-dollar attribution |
| Denial accountability (2.16) | Denials, appeals, overturns by plan, market, service category, reason, with timestamps | NO | Existing reporting covers federal-Marketplace QHPs only; "other" is the modal reason; 160M+ in employer coverage excluded (p055) |
| Delay accountability | Request, determination, appeal and payment timestamps per authorization and claim | NO — AND NOT PROPOSED ANYWHERE | No RFI proposal captures elapsed time. See Section 6.4 |
| TPA and ASO fee reasonableness (3.17, 3.18) | Fees by component; provider contract terms; affiliate flows; plan-sponsor audit rights | NO | TPA contracts "include non-disclosure and similar clauses that restrict data sharing and bar the use of independent auditors" (p081) |
| Ghost-network penalties (2.2) | Directory accuracy verified against claims-derived actual practice patterns, with appointment-availability testing | NO | Directory accuracy is currently self-attested |
| System-wide transparency via APCDs (3.23) | All-payer claims data including self-insured ERISA plans | NO | The RFI never mentions Gobeille v. Liberty Mutual (577 U.S. 312 (2016)), which preempts state APCD mandates as applied to self-insured ERISA plans. Verified absent from all 86 pages |
One line in this register reads "PARTIAL." Every other remedy the RFI leans on cannot be enforced today, because the data needed to enforce it does not exist.
Exhibit 4 — Gap register
Channels our extraction model identifies that the RFI does not address, or addresses without a remedy.
| # | Gap | RFI status | Consequence |
|---|---|---|---|
| G1 | Automated adjudication as the operative mechanism | Five body sentences (p049, p052, p053, p054×2); zero proposals; only direct ask is voluntary and addressed to insurers (p054) | Every procedural remedy is calibrated to a human-rate adversary |
| G2 | Delay as a harm distinct from denial | Named only via a court summary (p047) and 72-hour Oregon example (p053); no measurement proposal | An approval arriving after the clinical window closes never appears in denial statistics |
| G3 | Non-compliance with existing obligations as the primary enforcement target | Documented four times (p056, p058, p064, p085); framed as background, not as strategy | The one reform path requiring no legislation is left unbuilt |
| G4 | Chronic and contested-diagnosis illness | One clause (p051); zero occurrences of long COVID, ME/CFS, chronic illness, post-viral | The population where all three axes fail worst is absent from the framework |
| G5 | Network construction as a profit instrument | Stated at p083 (repricers profit from keeping providers out of network) but never connected to ghost networks at p048 | Narrow networks are treated as a cost-control byproduct rather than as an input to a fee-generating machine |
| G6 | Float and time-value of retained premium | Named once — "even if only temporarily" (p059) — never quantified or remedied | Delay has independent economic value to the payer, unaddressed by any proposal |
| G7 | Patient-borne administrative cost | Provider burden quantified (p049, p060); patient burden asserted, never measured | The largest single cost of the denial system is invisible to the regulator |
| G8 | Payer-authored medical policy as self-regulation | The RFI asks the right question at p054 and cites the rulification literature (p050 fn 208, p059 fn 249) without adopting its thesis | Plans write the criteria, apply them, and adjudicate challenges to them |
| G9 | Gobeille and ERISA preemption of claims-data reporting | Absent from all 86 pages | The transparency architecture at p085-086 has a Supreme-Court-shaped hole in it |
| G10 | Internal incentive compensation tied to denial rates | Asserted once without citation — "Some health plans even use incentive-based internal review processes that reward denials" (p052) | The most direct evidence of intent is stated and then dropped |
| G11 | AI regulatory parity | Absent | The available rulemaking-only remedy (Brailer) is never raised |
| G12 | No consolidated question list in 86 pages | Absent | Respondents must reverse-engineer roughly 60 asks from prose, biasing the response pool toward well-resourced trade associations |
| G13 | The hospital price base | Absent as a mechanism. Hospital prices are cited three times (p019, p034, p071) and read as evidence about insurers | The largest gap in the document, and the one two independent methods agree on. Insurer-conduct rules govern how the dollars are contested; the 254-percent-of-Medicare hospital price decides how many dollars there are. See 4A.4a and Exhibit 5 |
| G14 | Hospital revenue-cycle and coding AI | Conceded in two words at p053 ("health insurers and providers"); never returned to. p084 sees revenue-cycle economics only when an insurer owns the vendor | Half the AI problem is unexamined. Insurer denial AI and hospital billing AI are automating against each other, and both costs land on the premium. See 8.6a |
| G15 | Inaccessibility as a harm distinct from both denial and delay | The RFI's own standard at p014 is "access, afford and receive"; its proposals address the nominal layer. Ghost networks appear once (p048) as a directory-accuracy problem. Closed panels and appointment waits are named only inside a summary of a court's reasoning (p047), never as a Committee proposal | Care that is nominally covered, formally approved and never obtainable produces no denial, no delay metric and no record of any kind. It is the only major harm in this report that is invisible to every instrument the RFI proposes. See 2.2 and 12.10 |
| G16 | Engineered inaccessibility — friction as a designed feature | Absent as a mechanism. The RFI records the symptoms — unreachable out-of-pocket maxima (p025), 0.2 percent appeal rate (p057), coverage "not affordable in practice" (p029) — and attributes none of them to design | If friction is incidental, the remedy is better administration; if it is engineered, the remedy is penalties on realised outcomes, because a party that benefits from friction will always out-administer a rule that assumes good faith. See 12.10.4 |
| G17 | Payment discrimination against independent practice | Absent. The RFI sources the affiliate-favouring direction — 17 percent above market to owned physician groups (p073) — and never states the mirror: independents paid below owned competitors for the identical service | The differential is the acquisition mechanism. It raises reported care spending while reducing care purchased per dollar, and ends in the consolidation whose price effects this report sources at 14.1 percent. See 12.10.3 |
| G18 | Rebates and kickbacks as a general accounting channel | Partially addressed, and only inside pharmacy benefit management: "pass-through of rebates" for TPA and ASO arrangements (p080-p084), which concedes they are not passed through today. Never generalised into an accounting rule | Any ratio measuring gross payments while ignoring the return leg can be satisfied without one additional dollar reaching a clinician. See 2.1 and 12.2 |
So what? Sixteen of these eighteen gaps are not places where we disagree with the Committee about policy. They are places where nobody has written down how the money actually moves. Supplying the mechanism is worth more to the Committee than arguing a position.
On G15 and G16 specifically, and why they are separated. G15 is a measurement gap: the harm exists and nothing counts it. G16 is a causal claim: that the friction is designed rather than incidental. These carry different evidentiary burdens and we keep them apart deliberately. G15 follows from the RFI's own figures. G16 is ANALYST — supported by the pattern of symptoms the RFI documents and by the plain observation that every party with the ability to reduce friction profits from retaining it, but not established by any source stating intent. The policy consequence is the same either way, which is the useful part: outcome-based rating in 12.10.4 penalises the result whether or not anyone can prove the intent, and it is therefore the remedy that does not require us to win the argument about motive.
4A. This is the blueprint for the next Democratic health bill, and it is a document about insurers only
Answer first: the RFI is about health insurers and almost nothing else. Measured against our own extraction taxonomy, it addresses roughly $578 billion of the $1.8 trillion to $2.4 trillion our model measures — 24 to 32 percent — and leaves $382 billion a year in named, quantified extraction either missing from 86 pages entirely or gestured at with no mechanism attached. The biggest single absence is hospital and health-system extraction at $306 billion, which the document never once diagnoses as a problem. This is worse than an ordinary scoping complaint, because the RFI calls itself the successor to the Committee's 2008 "Call to Action," the paper that preceded the ACA (p002). Whatever is missing here will be missing from the next Democratic health reform bill. Mistake one actor for the system and you get remedies that squeeze insurer margin while the rest of the machine keeps running — and the share of the premium dollar reaching care need not move at all.
We are not arguing the RFI should have been a different document. We are arguing that it wrote its own test on page 4 and then failed it.
4A.1 The document's own standard, and its own provenance
Two passages establish both claims, and both are quoted verbatim.
On provenance (p002):
"In 2008, the Finance Committee released a paper outlining many of the challenges with America's health care system, along with options for needed reforms. Two years later the Affordable Care Act was signed into law, representing the largest health reforms in America since the establishment of Medicare and Medicaid. Senate Democrats are taking on this challenge once again in order to build the foundation for the next generation of meaningful, consensus-driven reforms and swift legislative action at the next opportunity."
That is an explicit claim of lineage to the pre-ACA drafting document, and an explicit statement of purpose: to build the foundation for the next reform and to enable "swift legislative action at the next opportunity." SOURCED. A document that bills become drafted from is not judged on whether it is interesting. It is judged on what it leaves out, because what the framing document leaves out is what the bill leaves out.
On scope (p004):
"These challenges cannot be fully addressed without system-wide reforms and cost-containment policies that require every industry in the health care sector to provide constructive solutions."
SOURCED, emphasis added. That is the RFI's own test, and it is the right test. The RFI fails it.
Fair credit, stated before the criticism. The RFI twice acknowledges limits on its own reach. At p002: "It is not intended to be an exhaustive summary of the challenges before us and the ways they could be addressed." At p004 it identifies itself as "the second in a series of long-term projects led by Senate Democrats to develop those reforms, following a June 2026 RFI focused on lowering prescription drug prices and reducing costs for patients." SOURCED. Pharmaceutical extraction — $240 billion annually in our model — is therefore deliberately deferred, not omitted, and we exclude it from every unaddressed total in this section. Counting pharma against the RFI would get our submission thrown out, and it would deserve to be.
The deferral defence covers drugs. It does not cover hospitals, facility fees, the nonprofit tax exemption, or Medicare Advantage risk-score inflation. No RFI in the series, past or announced, covers any of those. They are simply not in the frame.
4A.2 Page and section allocation
Structural boundaries verified from the page files: front matter and executive summary p001-p013; Section 1 "Reversing Republican Cuts and Reimagining a Better Path" p014-p043; Section 2 "Making Health Care Simpler for Families" p044-p069; Section 3 "Taking on Corporate Greed" p070-p086.
| Component | Pages | Count | Share of 86 | Extractive actor scoped |
|---|---|---|---|---|
| Front matter, introduction, executive summary | p001-p013 | 13 | 15.1% | Insurers; Republican policy |
| Section 1 — coverage architecture, rate review, public options | p014-p043 | 30 | 34.9% | Insurers |
| Section 2 — prior authorization, denials, networks, appeals | p044-p069 | 26 | 30.2% | Insurers, TPAs |
| Section 3 — "Taking on Corporate Greed" | p070-p086 | 17 | 19.8% | Insurers, insurer affiliates, PE |
| Non-insurer extraction as a diagnosed problem | p072-p073 (private equity only) | ~1.5 | ~1.7% | Private equity |
The section titled "Taking on Corporate Greed" runs 17 pages, and 15.5 of them are about insurance companies and companies insurers own. Its own summary at p008 lists six topics: insurer stock buybacks and executive compensation; private-equity-backed entities; vertical integration and intercompany transfers; MLR reform; "third-party administrators and other middlemen owned by or affiliated with insurance companies"; and transparency across private markets. SOURCED. Five of six name insurers by construction. The sixth, private equity, gets about a page and a half.
Within Section 3 the internal allocation is: buybacks and executive compensation plus private equity p071-p073; vertical integration p074-p076; MLR p076-p079; middlemen, TPAs and repricers p080-p084; system-wide transparency p085-p086. Roman-numeral headings confirm the frame: heading IV at p080 reads "Stopping corporate insurance companies and third parties from making money by acting as unaccountable middlemen." SOURCED.
4A.3 Term frequency, and the distinction that matters more than frequency
Counts are newline-tolerant and case-insensitive across all 86 page files. Frequency alone proves little; the classification column is what matters. DIAGNOSED WITH REMEDY means the RFI calls the mechanism a problem and proposes something about it. BACKGROUND SCENERY means the word shows up as stakeholder, victim, footnote apparatus, covered benefit or payment recipient — present on the page, absent from the indictment.
The insurer family
| Term | Occurrences | Pages | Classification |
|---|---|---|---|
| insurer / insurers | 76 | 34 | DIAGNOSED WITH REMEDY |
| health plan(s) | 60 | 35 | DIAGNOSED WITH REMEDY |
| insurance company / companies | 143 | 60 | DIAGNOSED WITH REMEDY |
| prior authorization | 75 | 18 | DIAGNOSED WITH REMEDY |
| denial(s) | 64 | 21 | DIAGNOSED WITH REMEDY |
| TPA(s) | 52 | 12 | DIAGNOSED WITH REMEDY |
| MLR | 35 | 8 | DIAGNOSED WITH REMEDY |
| middlemen | 29 | 10 | DIAGNOSED WITH REMEDY |
| medical loss ratio | 20 | 9 | DIAGNOSED WITH REMEDY |
| vertical integration | 15 | 7 | DIAGNOSED WITH REMEDY |
| private equity | 12 | 3 | DIAGNOSED, WEAK REMEDY |
| stock buyback(s) | 9 | 5 | DIAGNOSED WITH REMEDY (see 4A.5) |
| intercompany | 7 | 5 | DIAGNOSED WITH REMEDY |
| executive compensation | 7 | 6 | DIAGNOSED WITH REMEDY |
| repricer(s) | 7 | 3 | DIAGNOSED WITH REMEDY |
| transfer pricing | 4 | 3 | DIAGNOSED WITH REMEDY |
| quality improvement | 4 | 3 | DIAGNOSED WITH REMEDY |
| ghost network(s) | 4 | 1 | DIAGNOSED WITH REMEDY |
| network adequacy | 2 | 1 | DIAGNOSED WITH REMEDY |
Insurer-family nouns — insurer(s), health plan(s), insurance company/companies — total 279 occurrences across 69 of the 86 pages. "Insurance company" or "insurance companies" alone appears 143 times on 60 pages.
The provider and intermediary extraction family
| Term | Occurrences | Pages | Classification |
|---|---|---|---|
| hospital(s), hospitalization(s) | 57 (48 in-context) | 29 | BACKGROUND SCENERY — see 4A.4 |
| PBM | 11 | 9 | NAMED AS COMPARATOR, UNREMEDIED HERE |
| health system(s) | 10 | 10 | BACKGROUND SCENERY |
| consolidation | 4 | 3 | NONE PROVIDER-SCOPED — see below |
| pharmacy benefit manager | 3 | 2 | NAMED AS COMPARATOR |
| revenue cycle | 3 | 2 | DIAGNOSED — insurer-imposed only |
| surprise billing | 1 | 1 | BACKGROUND SCENERY (p037, in a public-option description) |
| provider consolidation | 0 | — | ABSENT |
| facility fee | 0 | — | ABSENT |
| site of service / site-of-service | 0 | — | ABSENT |
| market power | 0 | — | ABSENT |
| monopoly | 0 | — | ABSENT |
| antitrust | 0 | — | ABSENT |
| nonprofit / non-profit | 0 | — | ABSENT |
| charity care | 0 | — | ABSENT |
| tax exempt / tax-exempt | 0 | — | ABSENT |
| 340B | 0 | — | ABSENT |
| sale-leaseback | 0 | — | ABSENT |
| roll-up | 0 | — | ABSENT |
| upcoding | 0 | — | ABSENT |
| risk score | 0 | — | ABSENT |
| coding intensity | 0 | — | ABSENT |
| balance billing | 0 | — | ABSENT |
| device | 0 | — | ABSENT |
| supply chain | 0 | — | ABSENT |
| group purchasing / GPO | 0 | — | ABSENT |
A reader who greps consolidat* across the 86 pages will get ten hits, and should know before reading
further what they are. Six are the word "Consolidated," and five of those six are the statute name
"Consolidated Appropriations Act" (p048 twice, p064, p084 twice — three of them inside footnotes). The
sixth is p027's "as markets become more consolidated." Only four are the noun "consolidation." We state
the composition because the difference between four and ten is the first thing a hostile reader will find,
and it is our precision rather than our undercount.
Of those four occurrences of "consolidation," not one refers to hospital or physician-practice consolidation. That is the claim the text supports, and no more than that. Verified in context, with the scoping distinguished:
- p028 — explicitly insurer-scoped. "Insurance company consolidation limits the ability of consumers in highly-concentrated markets to benefit from competition."
- p074, first occurrence — insurers as the consolidating party, providers as the object. "Consolidation and vertical integration accelerated in the late 2010s as large for-profit insurers acquired providers, pharmacies, and PBMs." This is the closest the RFI comes to naming provider-side consolidation, and it names it as something done to providers by insurers, not as provider market conduct.
- p074, second occurrence — explicitly insurer-scoped. "This consolidation enables creative accounting to maximize profits," anaphoric to the insurance-conglomerate sentence preceding it.
- p037 — unqualified market-level, no actor named. "Markets where there is limited competition due to consolidation," in a description of the State Public Option Act. The surrounding passage concerns insurance markets, but the sentence itself names no consolidating party.
SOURCED. A further market-level formulation uses a different word form and is therefore not counted in the four: p027, "increasingly lack access to high-quality choices as markets become more consolidated." It also names no actor. So: two explicitly insurer-scoped, one insurer-subject with providers as its object, one unqualified market-level — and none provider-scoped. That is the narrow statement the text will bear, and it is the one that survives a staffer's own read. To say instead that all four "describe insurer consolidation" would be written slightly harder than the document supports. "Provider consolidation," "market power," "monopoly" and "antitrust" appear zero times in 86 pages.
"Big Insurance" appears 11 times. There is no analogous phrase for any other actor.
PBMs need a careful reading, because this is where an unfair critique would overreach. The RFI mentions PBMs 14 times across the two spellings, but nearly always as a model for how to regulate insurer affiliates, not as a channel to close here. At p080: practices used by insurance company middlemen "have drawn comparisons to the strategies used by PBMs, some of which are owned by these same large insurance companies. There has been bipartisan support for cracking down on abusive PBM practices, and many consumer advocates support a similar crackdown on middlemen in the private insurance market." SOURCED. At p084 the ask is to "apply bipartisan PBM reforms to TPAs and affiliates." That is a real and useful proposal — it is item 3.22 in Exhibit 1 — but its object is the TPA, not the PBM. PBM extraction itself is NAMED-UNREMEDIED in this document, reasonably so given the June 2026 drug-pricing RFI.
4A.3a The hospital case, stated at its strongest, before we test it
Answer first: the hospital sector has a real case, parts of it are correct, and we concede those parts. What the case cannot explain is why systems carrying identical obligations charge such different prices, or why price rises on acquisition rather than on need. The concession narrows our claim; it does not dissolve it.
What follows is placed before the hospital finding deliberately. A submission that indicts the largest spending sector in American health care without first stating that sector's own argument is easy to discredit, and deserves to be.
The case, in its own terms
One. Hospitals are the only actor in the chain under a federal legal duty to treat. The Emergency Medical Treatment and Labor Act obliges a hospital with an emergency department to screen and stabilise any patient who presents, without regard to coverage or ability to pay. No insurer, no pharmacy benefit manager, no third-party administrator and no repricer carries an equivalent duty. The cost of discharging it is real, it is unbilled, and it falls on the hospital.
Two. Public payers reimburse below the cost of providing the service, and hospitals argue that commercial rates are the only place the shortfall can be recovered. This is the cross-subsidy argument, and it is the sector's central answer to the commercial-to-Medicare multiple: on this account the multiple is not a mark-up but an offset, and a hospital serving a heavily Medicaid population needs a higher commercial multiple than one that does not. The Medicare margin is real and we now carry it: MedPAC reports hospitals' aggregate fee-for-service Medicare margin at –13.0 percent in FY 2023, exclusive of coronavirus relief funds, and projects it stable at about –13 percent for 2025 SOURCED. The median margin among hospitals MedPAC classifies as "relatively efficient" — those achieving lower costs while still performing relatively well on a specified set of quality metrics — was –2 percent SOURCED, and this report never quotes the first figure without the second (4A.5d). No Medicaid-specific hospital margin is reproduced here: MedPAC's remit is Medicare, and we have not sourced a Medicaid equivalent from a body without an interest in the answer.
Three. Rural and safety-net solvency. Hospitals in thin markets have no volume to spread fixed costs across, and a reporting or rate obligation calibrated to a large urban system can be the marginal cost that closes a small one. The RFI recognises this in its own voice: administrative burden "can be particularly burdensome for less resourced providers, such as rural hospitals and solo" practitioners (p060) SOURCED.
Four. Labour. Since 2021 the sector has absorbed wage inflation, a nursing shortage and a period of heavy reliance on agency staffing at rates far above employed-staff cost. These are input prices the hospital did not set and largely could not refuse.
Five. Standby capacity. Trauma, burn, obstetric and intensive-care capability must be staffed and equipped whether or not it is used, and there is no billing code for readiness. A payment system that pays only for delivered services structurally underfunds the capacity to deliver them.
Six. Twenty-four-hour emergency access is a public good. The community consumes the option value of an open emergency department continuously and pays for it only on use.
What we concede, plainly
We concede three of these outright.
- EMTALA and uncompensated care are genuine unfunded obligations, unique to this sector, and any remedy that ignores them is badly designed.
- Rural and safety-net solvency is a real constraint, not a lobbying posture. A hospital that closes removes access absolutely, and no price measure recovers that.
- Standby capacity is genuinely mispaid by a fee-for-service architecture, and that is a defect in the payment system rather than misconduct by the hospital.
Therefore we narrow the claim, and the narrowing is binding on everything that follows. Our finding is not that hospitals are overpaid. It is that hospital pricing is the largest unexamined variable in the RFI's perimeter, and that a document setting out to reform affordability cannot leave the sector that is about 31 percent of national spending outside its questions. Our remedy should not fall on the hospitals for whom the cross-subsidy argument is true. Any instrument drawn from Section 12.5 should carry carve-outs keyed to existing Medicare designations — critical access, sole community provider, disproportionate share — so that the constraint binds on concentrated systems with pricing power and not on the institutions whose solvency the cross-subsidy argument actually describes. That is a design requirement, not a caveat.
Where the case does not carry, on this report's own evidence
The obligations are uniform; the prices are not. EMTALA applies identically to every hospital with an emergency department. Medicare and Medicaid rates are set nationally, with published geographic adjustment. Yet mergers between systems in already-concentrated markets raise prices by 6 to 65 percent — SOURCED36, HHS synthesis, 2025. Nothing about a merger changes a hospital's EMTALA duty, its payer mix, its standby obligations or its nursing costs. What changes is the absence of an alternative. A price movement produced by concentration alone cannot be explained by an obligation that did not move. This is the single strongest rebuttal available and it rests on a figure already in this report.
The same logic disposes of the acquisition channel. Physician-service prices rise 14.1 percent after a hospital acquires the practice, and nearly half of that increase is attributable to the exploitation of payment rules — SOURCED2, Capps, Dranove and Ody 2018 (J Health Econ 59:139–152) — with at least 47 percent of US physicians employed by or affiliated with hospital systems in 2024, up from under 30 percent in 2012 — SOURCED, GAO-25-107450. The same clinician, often in the same room, treating the same patient, at a higher price because the billing location changed. No uncompensated-care obligation is discharged by re-labelling the site of service.
And the cross-subsidy argument has now been tested directly, at hospital level, by the study the RFI itself cites. It failed. RAND examined more than 4,000 hospitals and asked precisely the question the cross-subsidy defence poses — whether hospitals with a worse public-payer mix charge more commercially:
"Very little variation in prices is explained by each hospital's share of patients covered by Medicare or Medicaid; a larger portion of price variation is explained by hospital market power."
SOURCED. The same finding appears in RAND's own summary of the round — "Most variation in prices is explained by hospital market power. Very little is explained by each hospital's share of patients covered by Medicare or Medicaid" — and in RAND's price-transparency programme description: "Hospital market power, gained through consolidation, explains most of the observed price variation." SOURCED. This is the testable prediction of the cross-subsidy hypothesis, tested at the level of the individual hospital, by a politically neutral institution funded in part by the Robert Wood Johnson Foundation, using the data the RFI relies on — and the prediction does not hold. The variable that explains commercial price is market power, not payer mix.
On the multiple itself, and now on the dispersion behind it. Commercial plans pay 254 percent of Medicare inpatient and 279 percent outpatient — SOURCED3, RAND, 2022 data, the Round 5.1 national average across inpatient and outpatient facility and professional services. That is a national average, and the dispersion around it is where the argument is decided. RAND reports that only Arkansas had an overall relative price below 170 percent of Medicare, while eight states — California, Delaware, Florida, Georgia, New York, South Carolina, West Virginia and Wisconsin — had relative prices above 300 percent SOURCED. And within states, RAND puts the hospital-level spread in spending terms: "Even within states, the difference between 25th and 75th percentile hospitals represents a 45% potential reduction in hospital spending" SOURCED.
Read those two findings together, because jointly they dispose of the defence. A near-twofold spread between states, and a within-state interquartile gap that RAND itself frames as a 45 percent spending-reduction opportunity, cannot be explained by obligations that apply uniformly — and RAND has separately established that public-payer share does not explain it either. Scope discipline on the 45 percent figure: it is a within-state interquartile gap expressed as a potential spending reduction. It is not a national range, and it is emphatically not a claim that 45 percent of hospital spending is extractive. We use it for what it is: RAND's own statement of how much of the spread is unexplained by anything the cross-subsidy argument names.
Two further published facts complete the picture, and both come from the sector's own regulator-adjacent advisory body. Hospitals' marginal profit on Medicare patients "remained positive in FY 2023," so hospitals are not losing money on the next Medicare admission SOURCED; and the all-payer operating margin "increased to 5.1 percent in 2023, up from 2.7 percent in 2022" — an improvement achieved "despite a decrease in coronavirus relief funds" SOURCED. A sector compelled by public underpayment to charge commercial multiples would not simultaneously be improving its all-payer margin as relief funding withdrew.
We still rest the causal claim on the merger and acquisition evidence above, where the causal variable is identified. The dispersion evidence is what closes the escape route.
Community benefit is an obligation the sector accepted in exchange for a tax subsidy, and it is measurable. Exhibit 6 carries nonprofit hospital operating surplus at $65 billion SOURCED18 (M13c) and the nonprofit tax exemption measured against charity care actually delivered at $28 billion SOURCED38 (M15). The cross-subsidy argument and a large operating surplus can both be true at a sector level, but they cannot both be true of the same institution in the same year, and Internal Revenue Code §501(r) already requires the institution to show which.
Executive compensation is a small number that answers a large question. Nonprofit hospital chief executives are paid $5 million to $15 million SOURCED (Exhibit 6, M22). The dollars are immaterial against $306 billion. The relevance is evidentiary: an institution genuinely operating at the edge of solvency does not price its own leadership at that level, so the compensation figure is useful mainly to identify the institutions to which the solvency argument does not apply.
And consolidation has not been shown to buy anything. The 6-to-65-percent price effect is not paired in the literature this report relies on with a demonstrated matching gain in quality or access. NOT AVAILABLE is the honest statement of the counter-evidence — we are not aware of, and do not cite, a finding that merger-driven price increases purchase proportionate improvement. That absence is not proof of harm, and we do not present it as such; it is the reason the burden should sit with the acquirer.
So what? The hospital case is strong enough that our remedy must be built around it: designation-keyed carve-outs, a price test at merger rather than a blanket rate cut, and site-neutrality where the service is identical. What the case cannot do is explain a price that moves when the market structure moves and stands still when the obligation moves. That is the gap the RFI does not look into, and the rest of Section 4A measures it.
4A.4 The hospital finding, and why it is the strongest evidence in this report
"Hospital" appears 57 times, 48 of them in readable context across 29 pages. We classified every one.
| Role in which "hospital" appears | Approx. count | Representative citation |
|---|---|---|
| Footnote titles, citation apparatus, URLs | 12 | p019, p034, p038, p056, p060, p061, p071 |
| Ally or listening-session stakeholder | 10 | p005, "listening sessions with nearly 250 patient advocates, consumer groups, researchers, hospitals, doctors, and health plans"; p025, "organizations representing patients, consumers, hospitals and providers support reforms" |
| Victim of insurer-imposed burden | 7 | p060, "Hospitals report spending over $25 billion in claims adjudication in 2025"; p060, "Many hospitals report having delayed and unpaid claims that can exceed $100 million" |
| Payment recipient in public-option design | 9 | p026, "how to ensure that providers and hospitals receive adequate payment"; p030, "payment rates to doctors and hospitals" |
| Covered benefit or clinical noun | 4 | p009, "hospital stays"; p050, "preventable hospitalizations, longer hospital stays" |
| Network or directory object | 4 | p047, "whether a doctor or hospital is in their network" |
| Direct-contracting counterparty | 2 | p061, p084 |
| Hospital pricing or hospital market power as an extraction mechanism | 0 | No mention |
The keystone is at p071, and it is the most revealing sentence in the document. The RFI cites two of the most important studies of hospital pricing in the literature — the RAND employer-led transparency study, "Prices Paid to Hospitals by Private Health Plans," and Godwin and Levinson, "Hospital Prices Have Risen Much Faster for Private Insurance Than Medicare" — and uses both as evidence about insurers:
"And it is not clear that for-profit insurance companies are effectively negotiating on behalf of taxpayers, employers and consumers, since prices across the private insurance market are substantially higher than prices paid by public programs, and have increased faster over time." (p071) SOURCED
The same Godwin and Levinson study is cited at p019 to support the claim that "Costs across private insurance markets are growing significantly faster than in public programs," and again at p034. SOURCED. The RFI cites, three separate times, the best available evidence that hospital prices drive commercial cost growth — and reads all three citations as proof that insurers are bad negotiators. ANALYST: this is the whole framing problem in one move. The evidence of hospital pricing power is in the footnotes and turned upside down in the body. The drafters knew. Hospital prices were allowed into the document only as a fact about insurers.
So what? We do not have to prove hospitals extract. The RFI already cites the proof and files it under the wrong heading — pointing that out is worth more than any argument we could construct.
4A.4a Price is the base. Conduct is the contest.
Answer first: the RFI's insurer reforms govern how the dollars get fought over. The hospital price decides how many dollars there are to fight over. Those are different variables, and the RFI only has one of them.
Everything in the RFI's Section 2 and Section 3 operates on a number after it has been set. Prior authorization decides whether a service gets paid for. Denial and appeal decide who eats the cost of a service already delivered. MLR decides how much of the premium the insurer may keep. Every one of those rules takes the price of the service as given and argues about the distribution around it.
The price is not given. It is set in a bilateral negotiation between a health system and a plan, and in concentrated markets the system sets it. Commercial plans pay hospitals 254 percent of Medicare for inpatient care and 279 percent for outpatient care — SOURCED3, RAND, 2022 data. That multiple is the base. Prior-authorization reform does not touch it. A fee-per-member profit cap does not touch it. An MLR floor measured as a percentage of premium rises when it rises.
Two mechanisms push the base up, and neither one runs through insurer behaviour:
- Horizontal consolidation. Hospital mergers in already-concentrated markets raise prices by 6 to 65 percent — SOURCED36, HHS synthesis, 2025. The buyer does not become more expensive because an insurer behaved badly. It becomes more expensive because there is no longer an alternative to it.
- Site-of-service and facility-fee billing after physician acquisition. Physician-service prices rise 14.1 percent on average after a hospital acquires the practice, and "nearly half of this increase is attributable to the exploitation of payment rules" — SOURCED, Capps, Dranove and Ody, Journal of Health Economics 59 (2018) 139–1522. At least 47 percent of US physicians were employed by or affiliated with hospital systems in 2024, up from under 30 percent in 2012 — SOURCED, GAO-25-1074501, September 2025. The same doctor, in many cases the same room, at a higher price, because the billing location changed.
This is why the framing problem is not a scoping quibble, and it is the sharpest version of the argument in this report. Squeeze insurer margin perfectly and the hospital price base is exactly where it was. Section 4B.2 Route 3 then applies: the squeezed insurer stops fighting the rate increase, and the premium absorbs it. The RFI proposes to regulate the referee and leaves the scoreboard alone.
Exhibit 5 — The hospital price base, and where the RFI's perimeter stops
Every figure in this exhibit is SOURCED to the named body. These figures are carried from the external structured review of 30 July 2026 (Thomas Ferguson, independent of Brainworks; attribution at 4A.4c), which states it checked them against current public sources. We have not independently re-derived them from the primary CMS, KFF, RAND, GAO or HHS releases. That distinction is recorded in our verification log and should be stated in any submission that uses them.
| Measure | Figure | Source and vintage | Does the RFI reach it? |
|---|---|---|---|
| Hospital care, national health spending | ~$1.6 trillion · ~31 percent of the total, 2024 | CMS National Health Expenditure data via KFF | No. No hospital price or hospital spending share appears in 86 pages |
| Hospital share of national spending growth, 2022-2024 | ~40 percent · ~$277 billion | KFF | No |
| Hospital services as a share of privately-insured spending, 2022 | ~42 percent | RAND | No |
| Commercial hospital price against Medicare | 254 percent inpatient · 279 percent outpatient, 2022 data | RAND | Cited, and read as evidence about insurers — p019, p034, p071. See the keystone above |
| Price effect of hospital mergers in concentrated markets | +6 to 65 percent | HHS synthesis, 2025 | No. "consolidation" appears 4 times — two insurer-scoped, one insurer-subject with providers as object, one unqualified market-level, none provider-scoped (4A.3); "market power," "monopoly," "antitrust" appear 0 times |
| Physician-service price rise after hospital acquisition | 14.1 percent, nearly half from exploitation of payment rules | Capps, Dranove & Ody 2018 (J Health Econ 59:139–152) | No. "facility fee," "site of service" appear 0 times |
| Physicians employed by hospital systems | ~47 percent in 2024, up from under 30 percent in 2012 | GAO | No. The RFI names Optum as "the nation's largest physician employer" (p074) and treats physician employment only as an insurer problem |
| Hospital spending to overturn improper denials | $18 billion of $25 billion in claims-adjudication cost, 2025 | The RFI's own text, p060, citing Premier | Yes — and this is the only hospital economic figure in the document. It measures hospitals as victims |
Read the last row against the six above it. The RFI contains exactly one number about hospital finances. It is the number that makes hospitals sympathetic. Every number that would make them a subject is absent.
A section called "Taking on Corporate Greed" that leaves out the highest-priced corporate actor. That is the sharpest available statement of the finding, so we tested each of the five mechanisms against the page files before asserting anything. Results, verified by exhaustive case-insensitive grep across all 86 pages:
| Mechanism | Grep result | Grade | Basis |
|---|---|---|---|
| Horizontal hospital consolidation | "consolidation" 4 times, none of them provider-scoped — two explicitly about insurers (p028 "Insurance company consolidation"; p074, "this consolidation enables creative accounting"), one with insurers as the consolidating party and providers as its object (p074, "large for-profit insurers acquired providers, pharmacies, and PBMs"), and one unqualified market-level with no actor named (p037, markets with "limited competition due to consolidation"). Of the ten consolidat* hits in the document, five are the statute name "Consolidated Appropriations Act." "market power" 0, "monopoly" 0, "antitrust" 0. "merger" 3 times: twice inside a p074 footnote title and URL about CVS-Aetna, and once in body text at p075 — a transparency bullet asking for "data collection and public reporting on health plan and provider ownership structures, mergers, acquisitions, affiliates and financial relationships." That bullet is the RFI's only reference to provider mergers in 86 pages, and it is a reporting ask with no price test, no rate constraint and no antitrust referent |
ABSENT | Verified |
| Nonprofit-hospital tax exemption and community-benefit shortfall | "nonprofit" 0, "non-profit" 0, "tax exempt" / "tax-exempt" 0, "charity care" 0, "community benefit" 0 | ABSENT | Verified |
| Health-system executive compensation | "executive compensation" appears on p002, p003, p008, p012, p071, p072 — and on every one of them the possessor is an insurance company. p072 is headed "Stock Buybacks and Executive Compensation" and quantifies only insurer CEOs: "The CEOs of these companies collectively received nearly $150 million in total compensation in 2024" (p072) SOURCED | ABSENT for hospitals; ADDRESSED for insurers. Recorded in Exhibit 6 as M8's "asymmetric scope" | Verified |
| Chargemaster pricing | "chargemaster" 0 | ABSENT | Verified |
| Out-of-network pricing | Present, four times, and never as hospital pricing. p036 asks about "new approaches to paying for out-of-network care" in a public option design. p048 proposes "stronger protections for consumers against unexpected out-of-network costs" as a ghost-network penalty and references the No Surprises Act. p083 describes repricers who profit by "working to establish lower out-of-network reimbursement." The fourth occurrence spans the p083-p084 page break — p083 ends "keeping certain providers out of" and p084 opens "network so they can charge higher rates" — with the footnote apparatus and the page number intervening between the two halves. A per-page search returns three; a search over the concatenated document returns four. We count four | NAMED-UNREMEDIED as to the provider price; ADDRESSED as to insurer and repricer conduct. Not graded ABSENT | Verified. Corrects the cruder claim that out-of-network pricing is missing altogether |
Four of the five are flatly absent. The fifth is present with the causal arrow pointed the other way — at p083 the out-of-network price is high because a middleman engineered it, which is a real mechanism and not the hospital-pricing one. We grade it NAMED-UNREMEDIED rather than ABSENT and say so, because overstating a zero is how a submission loses a hostile reader.
4A.4b The victim frame, and why it makes hospital pricing unaskable
A caveat first, stated here rather than in a footnote, because a hostile reader should meet it at the same moment as the claim. What follows is interpretive and is not load-bearing. It reads a pattern in the document's grammar, and a reader who thinks that reading over-clever should discard it without cost to anything else in this memorandum. The finding of Section 4A rests on dollar magnitude and term counts: $382 billion in named, quantified extraction outside the RFI's perimeter, of which $306 billion is hospital and health-system extraction, and a set of terms that appear zero times in 86 pages. Those are countable and they carry the point on their own. The frame argument below explains how an omission of that size can be total rather than partial; it is not the evidence that it is.
Answer first: the RFI's structural explanation for the hospital omission is in the document itself. It casts hospitals as counterparties injured by insurers. You cannot audit the pricing power of the party you have just cast as the injured one. We tested this claim against the page files rather than asserting it, and it holds.
The injury is stated in dollars, on one page:
"Hospitals report spending over $25 billion in claims adjudication in 2025, and estimate that at least $18 billion was spent on avoidable administrative work to overturn improper claims denials." (p060) SOURCED46
The remedies follow the frame. The RFI asks how to return money to hospitals — "we seek feedback on whether and how the excessive revenue generated through these administrative abuses could be returned to providers, hospitals and consumers" (p060) SOURCED. It records hospital cash-flow injury — "Many hospitals report having delayed and unpaid claims that can exceed $100 million at a given time" (p060) SOURCED. It offers to lift work off them — "We invite proposals that would streamline the responsibilities that doctors and hospitals are required to take on" (p060) SOURCED. And the prompt-pay proposal is introduced as the hospitals' own: "One approach proposed by several hospital and provider groups during listening sessions would address administrative waste by requiring large health plans to make prompt payments to providers and collect applicable copays and cost-sharing directly from patients" (p061) SOURCED.
The clearest single proof of the frame is at p060, and it is a sentence about who causes what. The RFI writes: "Many of the processes that providers and hospitals are required to undertake in order to navigate prior authorizations and receive payment for claims are established by insurance companies" (p060) SOURCED. Read as written, that is true. Read as a theory of the system, it assigns hospitals the role of rule-taker. A rule-taker does not set a price at 254 percent of Medicare.
ANALYST: this is a self-contained structural explanation for the omission, and it needs no account of why the frame was adopted. The claim is narrow and mechanical: once hospitals enter the document in the grammatical position of the object — the party things are done to — there is no sentence left in which they set a price. The frame is observable in the document's own sentences whatever its origin, and because it is grammatical rather than editorial it makes the question unaskable page after page without anyone having to suppress it. That is why the omission is total rather than partial: not one of the 86 pages contains a hospital in the subject position of a pricing sentence. A document does not have to keep deciding to leave something out once its grammar has already decided. Why a frame of that shape comes to be adopted is a question this memorandum does not take up — the finding here is mechanical and does not depend on any account of motive.
The one place the frame breaks, and the RFI does not notice. At p061 the RFI asks for "proposed reforms to leveling the playing field for smaller providers in highly concentrated markets" (p061) SOURCED. That sentence concedes provider markets are concentrated and that concentration disadvantages someone. It is the closest the document comes to naming hospital market power — and it appears as a request to help small providers, not as a diagnosis of large ones. Note the asymmetry: the RFI is willing to say a provider market is concentrated when the harm falls on another provider, and not when the harm falls on a premium payer.
So what? The victim frame is not a bias to be complained about. It is a load-bearing structural feature we can point at: the document's own $18 billion figure is the proof that it knows how to count hospital money, and the proof that it only counted the money hospitals lose.
4A.4c Independent corroboration: a second method reaches the same finding
Answer first: an outside structured review, using a different framework and different data, reaches our conclusion — hospitals are the largest omission. Two independent methods converging on one finding is the strongest evidentiary position in this report, and it should be stated in the submission before any of the arithmetic.
We reached the hospital finding from our own Volume 2 taxonomy: build the extraction map first, test the RFI against it, and the largest unaddressed channel comes out as hospital and health-system extraction at $306 billion (Exhibit 6, M13). That is a dollar-magnitude argument reinforced by a term-frequency count.
A separate document reaches the same conclusion without using any of our figures. Structured Analytical Review, Revised Edition — AI-Driven Medical Inflation vs. the Senate Finance Health-Coverage RFI, dated 30 July 2026, applies propositional logic, Rescher's dialectics, Analysis of Competing Hypotheses and a gap inventory to two documents at once: the Brailer Health Affairs Forefront piece of 11 June 2026 and this RFI. Its central corrective finding is that both documents omit hospitals, and that this is the single largest shared blind spot.
The attribution, stated in full, because a corroborating source that cannot be identified corroborates nothing. The review is the work of Thomas Ferguson, and it was produced independently of Brainworks — not commissioned by us, not drafted by us, and not written against our taxonomy. It reached us on 30 July 2026, the day of its date. Its evidence base is entirely public: CMS National Health Expenditure data via KFF, the RAND hospital-price transparency studies, and the HHS and GAO consolidation syntheses. It uses none of the figures in our Volume 2, and no figure of ours was available to it. The archived copy of the document, with its tables, is retained in our working files (Appendix A.5) and can be supplied to the Committee on request. Everywhere below where this report says "the external structured review of 30 July 2026," it means this document and no other. Readers who wish to discount the convergence should do so on the merits of that review, which is checkable, rather than on doubt about whether it exists.
The ACH result, reported as that review's own assessment and labelled ANALYST because probability bands over competing hypotheses are analytic judgments, not measured frequencies:
| Hypothesis | That review's assessment | Band |
|---|---|---|
| H6 — hospital and provider market power and pricing (consolidation plus facility fees) | Fewest inconsistencies; uniquely explains the price and consolidation evidence that dominates commercial growth. Co-leading | Likely, 60-75 percent |
| H2 — fee-for-service payment structure | The incentive that hospital market power exploits; complements H6 rather than competing. Co-leading | Likely, 55-70 percent |
| H5 — underlying medical cost growth (drugs, technology, ageing, prices) | Strong on drug evidence; overlaps H6 on hospital prices | Likely contributor, 50-60 percent |
| H1 — for-profit insurer conduct (the RFI's thesis) | Real on the profit evidence; contradicted as a sole cause by public-programme upcoding and by hospital-price dominance. Partial | Roughly even as sole cause, 35-45 percent |
| H4 — Republican policy choices and coverage cuts | Explains the coverage and access shock; narrower than the cost trajectory | Contributing, 30-45 percent |
| H3 — AI as an independent primary driver | Disconfirmed as a standalone driver by Brailer's own framing | Unlikely alone, 15-25 percent |
All six bands are that review's judgments, not ours. We are not adopting them as our estimates. What we adopt is the convergence.
Why this is method triangulation and not two people agreeing. The two routes share no inputs and no procedure. Ours is an accounting decomposition against a taxonomy built before we read the RFI, checked by exhaustive term counts across 86 pages. Theirs is a structured-hypothesis competition scored on inconsistency against public price and consolidation data, applied to two documents neither of us wrote together. Two methods with no common failure mode landing on the same omission is much harder to rebut than either one alone. A Committee staffer can argue with our Volume 2 magnitudes or with their probability bands. Arguing with both at once requires explaining why hospitals — 31 percent of national spending and about 40 percent of its recent growth — are absent from a document that sets out to reform affordability.
The one row in that analysis most useful to us: Medicare Advantage overpayment. The largest single extraction line either analysis names — $76 billion, MedPAC's total projected 2026 MA overpayment against traditional Medicare, of which about 11 of the 14 percentage points are favourable selection and about 4 are coding intensity SOURCED42 — sits inside a public programme. Our report already carries that figure (Exhibit 6, M16; Section 4C.1). Connecting the two is worth stating plainly: extraction is structural, not ownership-specific. Risk-adjusted payment machinery, run for a public payer, produces the largest single number in the taxonomy — and the larger component of it, favourable selection, is not misconduct by an owner at all but a property of the payment formula. That cuts against the RFI's implicit theory that ownership form is the causal lever — which is a completeness objection, exactly the one 4A makes, arrived at from the other side. It also reinforces the waterbed principle in 4B: if the mechanism is structural, regulating one owner type relocates it rather than removing it. 4B.1 now cites it.
Where we declined to import. That review's confidence ratings for the Brailer document, its dialectical verdicts ("proponent wins," "draw"), and its recommendations for a combined submission are its own analytical products and stay attributed to it. We import three things: the public-source hospital figures (Exhibit 5, labelled and caveated), the price-base mechanism (4A.4a), and the convergence itself.
So what? Lead the submission with this. Our number can be argued with. The convergence of two unrelated methods on the same absence cannot be argued with without arguing that hospitals do not matter.
Exhibit 6 — The coverage matrix
Our extraction taxonomy, built from Volume 2 first, then tested against the RFI. Dollar magnitudes are SOURCED from Volume 2 of the Brainworks extraction model (2024 NHEA base) unless labelled otherwise. Status definitions: ADDRESSED = diagnosed with at least one specific proposal; GESTURED AT = named as a problem, remedy generic or optional; NAMED-UNREMEDIED = appears in the text but no proposal attaches; ABSENT = no mention in 86 pages.
Axis ratings follow Section 2. Where a mechanism is ABSENT, the axis ratings describe what the RFI does to that mechanism, which is usually nothing — so the rating reads NEUTRAL. Reading NEUTRAL against a $95 billion channel is the finding, not a blank.
| # | Mechanism | Vol 2 magnitude | Status | Page cite | What the RFI proposes | Axis 1 | Axis 2 | Axis 3 | Verdict |
|---|---|---|---|---|---|---|---|---|---|
| M1 | MLR gaming via quality-improvement reclassification | Component of $316B direct insurer cost; QIA misclassification "hundreds of millions" per RFI (p078) SOURCED18 | ADDRESSED | p076, p078 | Prohibit classifying UM as QIA; bar late-plan-year loading; independent outcomes-based classification | STRONGLY POSITIVE | IMPROVES | LOW | Best-designed item in the document. Rulemaking-only |
| M2 | Vertical integration and intercompany transfer pricing | $60B intercompany margin at CVS alone SOURCED; eliminations ≈ 1/3 of UHG 2025 revenue (p075) SOURCED | ADDRESSED | p074-p076, p079 | Benchmark affiliate rates to unaffiliated; limit share of transfers reportable as medical spend; disallow internal markups; ownership reporting | STRONGLY POSITIVE | UNCHANGED | LOW-MEDIUM | Strongest Axis 1 lever in the RFI. Ask verbs are the weakest in the document |
| M3 | Prior authorization and denial as revenue | $35B PA processing; $191B care-prevention economy; $18B avoidable hospital rework (p060) SOURCED18 | ADDRESSED | p049-p060 | Presumptive approval, timeout approval, independent adjudication, automatic external review, gold carding, penalties keyed to overturn rates | STRONGLY POSITIVE | IMPROVES | LOW to HIGH by item | Most complete treatment in the RFI. See Sections 8 and 11 |
| M4 | Administrative overhead as profit centre | $316B direct insurer; $236B provider-side; $25B patient-side; $578B total SOURCED18 | ADDRESSED | p059-p061, p020, p079 | Rate review of administrative cost growth; fee-per-member caps; independent clearinghouse; consolidated invoice | STRONGLY POSITIVE | IMPROVES | LOW-MEDIUM | ADDRESSED for the insurer share; patient-side burden never measured. Gap G7 |
| M5 | TPA and ASO fee structures | Component of $578B; ASO profits ~5x fully-insured (p080) SOURCED18 | ADDRESSED | p080-p084 | PMPM-only fee structure; fiduciary duty; MLR extension; pass-through of rebates and shared savings; independent conflict-free TPAs | STRONGLY POSITIVE | UNCHANGED | LOW-HIGH | ADDRESSED, and load-bearing — this is the >60% of the market (p062) |
| M6 | Repricers and insurer-imposed revenue-cycle cost | $13B RCM; $150B provider billing and coding staff SOURCED | ADDRESSED | p083-p084 | Repricer reform; pass spread-pricing profit to sponsors; RP-strength ask | STRONGLY POSITIVE | IMPROVES | MEDIUM | ADDRESSED for the insurer-imposed share only |
| M7 | Stock buybacks and dividend extraction | $180B shareholder cash returns; $45B buybacks and $20B dividends in the insurer segment SOURCED18 | ADDRESSED, MISTARGETED | p071-p072 | Tax or restrict buybacks; limit executive compensation; limit non-health-care investment | MARGINAL | UNCHANGED | HIGH | Targets disposition, not capture. See 4A.6 and Section 11.17 |
| M8 | Executive compensation | $8B above $500k in the insurer segment SOURCED18; nonprofit hospital CEOs $5-15M SOURCED | ADDRESSED for insurers, ABSENT for providers | p072 | Limit executive compensation | MARGINAL | UNCHANGED | HIGH | Asymmetric scope. Nonprofit hospital compensation is a tax-code question squarely in Finance jurisdiction and is absent |
| M9 | Network construction and ghost networks | No separable dollar — sized in components, net addable $0. 82% of listed in-network mental-health providers were "ghosts" and appointments were secured 18% of the time — Senate Finance Majority staff secret-shopper study, 2023 SOURCED48 (n=120 calls, Medicare Advantage mental health, 6 urban counties; see caveats at 4C.4). Behavioral care 5.2× more likely out-of-network than medical/surgical, and behavioral providers reimbursed 23.8% below primary care on identical codes — Milliman 2019 SOURCED43. Overlaps M3 and M14; not separately addable. The profit-instrument claim is ANALYST — no source asserts intent | GESTURED AT | p047-p048, p083 | Network adequacy federal floor; ghost-network penalties; remove repeat offenders | NEUTRAL | IMPROVES nominal | HIGH | See 4A.7 — the lock-in problem. RFI never connects p083 repricer incentive to p048 ghost networks (gap G5) |
| M10 | Private equity roll-ups, sale-leasebacks, dividend recapitalisation | No dollar figure. The published evidence does not support a defensible national aggregate, and we assert none — the grounds are set out at 4A.5a. What the row carries instead is stronger: named-case extraction mechanics from a bipartisan Senate Budget Committee investigation, four peer-reviewed findings on price and quality, and a GAO finding that federal ownership data cannot identify private-equity owners at all. Steward: $1.3B extracted, $9B system debt SOURCED47. Full treatment at 4A.5a | GESTURED AT | p072-p073 | Ownership database; Oregon-style corporate-practice limits; restrict investment types. "roll-up" 0 hits, "sale-leaseback" 0 hits, "dividend recapitalisation" 0 hits | MARGINAL | INDETERMINATE | MEDIUM | Named, three bullets, softest ask verb. The three specific extraction mechanisms are absent by name |
| M11 | PBM spread pricing, rebate capture, pharmacy steering | $15-20B commercial spread pricing ANALYST (no published measurement of the commercial spread exists; state Medicaid audits document hundreds of millions, and commercial spread is unreported — this is our order-of-magnitude estimate, not a third-party figure) | NAMED-UNREMEDIED | p080, p084 | Apply PBM reforms to TPAs — object is the TPA, not the PBM | NEUTRAL | UNCHANGED | — | Deferred to the June 2026 drug RFI. Defensible |
| M12 | Pharmaceutical extraction | $240B SOURCED18 | DEFERRED BY DESIGN | p004 | Out of scope; prior RFI | — | — | — | Excluded from all unaddressed totals. Fair |
| M13 | Hospital and health-system extraction, total | $306B ESTIMATED — an estimate of commercial hospital prices in excess of Medicare-equivalent rates. It is one quantity, not a sum of the components below; the construction and an independent reconstruction from published inputs are set out at 4A.5b. The components are retained below as the mechanisms through which the excess is realised, not as four addable quantities | ABSENT | No mention as a mechanism | Nothing | NEUTRAL | NEUTRAL | — | Largest single absence in the document |
| M13a | — facility fee and site-of-service arbitrage | $95B ANALYST — our own judgement, and the scope stated plainly. It is an all-payer differential of our own construction; the published site-neutral estimates are Medicare-only and much smaller, and we neither cite them as support nor treat them as refutation (4A.5c). The anchoring published comparison is RAND's finding that common outpatient services in ambulatory surgery centres averaged 171 percent of Medicare prices but would have averaged about 107 percent if paid at hospital-outpatient-department rates SOURCED18 — a Medicare HOPD-to-ASC differential of roughly 1.6 times. Independently corroborated: physician-service prices rise 14.1% after hospital acquisition, nearly half from exploitation of payment rules (Capps-Dranove-Ody 2018, J Health Econ 59:139–152), and at least 47% of physicians were employed by or affiliated with hospital systems in 2024 (up from <30% in 2012) SOURCED2 — GAO-25-107450 | ABSENT | "facility fee" 0; "site of service" 0 | Nothing | NEUTRAL | NEUTRAL | — | Squarely within Finance's Medicare jurisdiction. The acquisition channel that produces this is live and growing |
| M13b | — for-profit hospital net income | $85B ESTIMATED — it is our own model's figure, and we located no third-party publication of a comparable measure | ABSENT | No mention | Nothing | NEUTRAL | NEUTRAL | — | Absent |
| M13c | — nonprofit hospital operating surplus | $65B ESTIMATED — on the same ground as M13b | ABSENT | "nonprofit" 0; "charity care" 0 | Nothing | NEUTRAL | NEUTRAL | — | Squarely within Finance's tax jurisdiction |
| M13d | — hospital supply chain and GPO markups | $61B ESTIMATED — on the same ground as M13b | ABSENT | "supply chain" 0; "group purchasing" 0; "device" 0 | Nothing | NEUTRAL | NEUTRAL | — | Absent |
| M14 | Hospital consolidation and lock-in arbitrage | $75B consolidation premium SOURCED18 (alternate Vol 2 waterfall cut; see note). Price effect independently sized: hospital mergers in concentrated markets raise prices 6-65% SOURCED36 — HHS synthesis 2025; commercial hospital price is 254% of Medicare inpatient / 279% outpatient SOURCED3 — RAND, 2022 data | ABSENT as diagnosis; ARGUABLY WORSENED | "consolidation" 4, none provider-scoped — two insurer (p028, p074), one insurer-subject with providers as object (p074), one unqualified market-level (p037); "market power" 0; "monopoly" 0; "antitrust" 0 | Network adequacy floor without any rate constraint | NEUTRAL | INDETERMINATE, plausibly WORSENS | HIGH | See 4A.7 and Exhibit 5. The one place the RFI holds the answer is p031, and never generalises it |
| M15 | Nonprofit tax exemption against charity care delivered | $28B SOURCED38 — overlaps M13c, see note | ABSENT | "tax exempt" 0; "tax-exempt" 0; "nonprofit" 0; "charity care" 0; "community benefit" 0 | Nothing | NEUTRAL | NEUTRAL | — | The purest Finance-jurisdiction item in the taxonomy, and absent |
| M16 | Medicare Advantage overpayment (total) — favourable selection and coding intensity | $76B total MA overpayment in 2026 vs traditional Medicare SOURCED42 — MedPAC, March 2026 Report to the Congress, Ch. 12 (the Medicare Advantage status report), cited first-hand (Bibliography 42; content confirmed against the claim, March 2026 edition). The decomposition is MedPAC's own and appears in the same chapter: ~11 percentage points favourable selection and ~4 points coding intensity, the latter about $22B | ABSENT | "upcoding" 0; "risk score" 0 | Nothing | NEUTRAL | NEUTRAL | — | Same conglomerates, same coding machinery, squarely Finance jurisdiction |
| M17 | 340B arbitrage | $57.8B gross list-to-340B spread, 2023, which "approximates the money collected by 340B covered entities" — Drug Channels Institute, derived from HRSA's $66.3B acquisition figure and IQVIA's $124.1B list value SOURCED31. Only 1.4% of contract-pharmacy branded prescriptions share the discount with the patient SOURCED. 87% flows to hospitals → overlaps M13; excluded from the additive headline to avoid double-counting hospital net income, exactly as M14 and M15 are excluded | ABSENT | "340B" 0 | Nothing | — | — | — | Jurisdiction partly explains this one (PHS Act, Energy and Commerce) |
| M18 | Surprise and out-of-network balance billing | Historical magnitude large, residual small. Pre-NSA $40B/yr in employer-insured spending — chiefly systemic in-network price inflation extracted under threat of out-of-network billing by hospital-based specialists, 2015 basis (Cooper, Nguyen, Shekita and Scott Morton) SOURCED28; PE-driven increase 32.3% to 42.8% of ER visits SOURCED. The No Surprises Act (2022) closed most of it; post-NSA residual ≈ $0.7B-$1.3B/yr ground-ambulance exposure ESTIMATED, shrinking as states legislate. Overlaps M10. Not separately addable; largely historical | NAMED-UNREMEDIED | p037 once; p048 No Surprises Act referenced | Nothing new | NEUTRAL | UNCHANGED | — | Largely resolved by existing law; fair to leave |
| M19 | Float and time-value of retained premium | $50B investment income, a component of $73B net profit SOURCED | NAMED-UNREMEDIED | p059, "even if only temporarily" | Nothing | NEUTRAL | UNCHANGED | — | Gap G6 |
| M20 | Legislative and regulatory capture | $6.36B lobbying since 1998; ~$1B annually in the insurer segment SOURCED | ABSENT | No mention | Nothing | — | — | — | Unsurprising in a Committee document. Noted for completeness |
| M21 | Chargemaster and hospital list-price setting | No addable dollar — mechanism enabler, not a separable channel. It is the base from which the RAND 254% / 279% multiples SOURCED3 are negotiated and the instrument applied to uninsured, self-pay and out-of-network patients; realised overcharges are already captured under M13 and M18. Directly chargemaster-attributable extraction is low-single-digit billions ANALYST and excluded from the headline total | ABSENT | "chargemaster" 0 | Nothing | NEUTRAL | NEUTRAL | — | Added on the external review's evidence. Carries no dollar, so it is excluded from the headline total |
| M22 | Hospital-system executive compensation | Component of M13c; nonprofit hospital CEOs $5-15M SOURCED (see M8) | ABSENT | "executive compensation" appears at p002, p003, p008, p012, p071, p072 — the possessor is an insurance company every time. p072 quantifies insurer CEOs only | Nothing for providers | NEUTRAL | NEUTRAL | — | Split out from M8 to make the asymmetry countable. Not separately added to the total — it sits inside M13c |
Three notes on the arithmetic. The total is the headline, so it has to survive a hostile read.
Note 1 — two decompositions, do not mix them. Volume 2 contains a primary channel decomposition (insurance intermediation $578B; shareholder cash returns $180B; hospital extraction $306B; pharmaceutical extraction $240B) and a separate cost-waterfall cut (including "hospital consolidation premiums $75B" and "stock buybacks $141B"). These are alternate views of the same system, not additive layers. M14's $75B is drawn from the waterfall and is therefore excluded from the headline total to avoid double-counting against M13. We show it anyway, because the mechanism matters even where we cannot safely add the dollar.
Note 2 — M15 overlaps M13c. The $28B nonprofit tax exemption is a tax expenditure; the $65B nonprofit operating surplus is an income measure. They are related and partially overlapping. M15 is excluded from the headline total. Counting both would inflate the indictment by up to $28B.
Note 3 — shareholder returns are where captured profit goes, not extra extraction on top. Volume 2 says so directly: buybacks and dividends "represent how profits are distributed, not additional extraction." M7 is therefore not added to the total. That is the same point that makes buyback caps the wrong instrument (4A.6).
Note 4 — the external review adds mechanisms and corroboration, and it does not change the total. Say so rather than let a reader wonder. The public-source figures imported in Exhibit 5 are spending shares and price multiples, not extraction estimates: $1.6 trillion of hospital care is the whole category, not the extracted part of it; 254 percent of Medicare is a price ratio; 6-65 percent is a merger price effect. None of them is a dollar of extraction that can be added to a Volume 2 line without double-counting the line it corroborates. M21 (chargemaster) and M22 (health-system executive compensation) carry no addable dollar — M21 has no Volume 2 figure and M22 sits inside M13c. The headline total is therefore $382 billion a year, and the omission is supported by an independent method (4A.4c) and by a mechanism argument (4A.4a) rather than by dollar magnitude and term frequency alone. A finding that survives new evidence without needing to move is stronger than one that grows.
The absences, ranked by dollars unaddressed
| Rank | Absence | Annual magnitude | Status | Finance jurisdiction? |
|---|---|---|---|---|
| 1 | Hospital and health-system extraction (M13) | $306B ESTIMATED (excess commercial price over Medicare-equivalent rates; method at 4A.5b) | ABSENT | Yes for M13a and M13c |
| 2 | Private equity extraction mechanisms (M10) | No dollar figure. The published evidence does not support a defensible national aggregate, so we assert none (4A.5a). The mechanism evidence is peer-reviewed and specific | GESTURED AT | Partly — tax code |
| 3 | Medicare Advantage overpayment, total (M16) — ~11 pts favourable selection, ~4 pts coding intensity | $76B SOURCED42 — MedPAC, March 2026 Report to the Congress, Ch. 12 | ABSENT | Yes, squarely |
| 4 | PBM spread pricing (M11) | $15-20B ANALYST | NAMED-UNREMEDIED | Deferred — fair |
| — | Not safely quantifiable without double-count | M14 $75B, M15 $28B | ABSENT | Yes |
| — | Named, no addable dollar | M21 chargemaster, M22 system executive pay | ABSENT | Yes for both |
| — | Quantified, none addable | M9 $0 net, M17 $57.8B gross (87% inside M13), M18 $40B historical / $0.7-1.3B residual, M21 $0 net | Not separately quantified in Vol 2 | Yes for M17 and M18 |
THE HEADLINE TOTAL, AND IT IS ONE NUMBER: $382 billion a year. ESTIMATED. The arithmetic is M13 $306B + M16 $76B = $382B — hospital and health-system extraction plus total Medicare Advantage overpayment, both flatly absent from the RFI and neither of them deferred. Pharmaceutical extraction is excluded as deliberately deferred; the three double-count exclusions (M14, M15, M7) are applied. This is the figure we ask the Committee to test us on.
There is one aggregate and no second figure. Every other channel in the taxonomy is either deliberately deferred, excluded to avoid a double-count, or carries no dollar we are willing to defend — and each of those dispositions is stated in the rows above rather than absorbed into a range. One number, $382 billion, built from two lines we can show.
The scope ratio, stated the other way. The RFI's addressed perimeter corresponds to roughly the $578B insurance-intermediation channel. Against Volume 2's total extraction estimate of $1.8 trillion to $2.4 trillion, that is 24 to 32 percent of measured extraction. ESTIMATED — this is a ratio of two of our own aggregates, not a published finding, and the arithmetic is: $578B / $2,400B = 24.1%; $578B / $1,800B = 32.1%.
An honest disclosure about our own taxonomy. Between the $382B we can name and what the $1.8-2.4T total implies, there is a large remainder that Volume 2 never breaks down to the mechanism level. We do not claim the RFI omits all of it, because we cannot say what all of it is.
Four rows of our own taxonomy carry no dollar figure in Volume 2, and the result of working them is mostly negative — which we report rather than bury. M9 (network construction), M17 (340B), M18 (balance billing) and M21 (chargemaster). The findings:
- M9 — no defensible standalone dollar, net addable $0. The phenomenon is heavily documented and the extraction dollar is nonetheless inseparable from M3 and M14 without double-counting. Sizing it would have required multiplying a component rate by a national denominator that does not match it — the precise error we attack the RFI for in Section 4C. We declined. This remains a mechanism we assert and cannot size, and we say so.
- M17 — $57.8B gross spread, but 87% flows to hospitals and therefore already sits inside M13's net income and surplus measures. Excluded from the additive headline exactly as M14 and M15 are excluded. The real finding is distributional rather than additive: only 1.4% of contract-pharmacy branded prescriptions share the discount with the patient.
- M18 — large historically, small now. $40B/yr pre-No Surprises Act, but chiefly systemic in-network price inflation extracted under threat of out-of-network billing — mostly premium, not patient balance bills, on a 2015 basis. The Act closed most of it; the residual is $0.7B-$1.3B/yr in ground-ambulance exposure and shrinking. Fair to leave, and now sized rather than asserted.
- M21 — no addable dollar, as the row already said. It is a negotiating base and an out-of-network weapon; the realised overcharge is inside M13 and M18.
None of the four adds a dollar to the headline total, and the headline is unchanged at $382B. Three of the four turn out to be non-additive by construction rather than merely unmeasured, which is a more useful result than a number would have been: it means the taxonomy was not understating the total, it was under-documenting three mechanisms. M9 is the exception and the honest failure — it stays unsized, and any submission should present it as a documented access-suppression mechanism whose profit magnitude is not established. Full derivations, sources and overlap analysis are retained in the quantification memo described in Appendix A.5.
Did the external review close any of those gaps? No, and we checked each one. It carries no figure for network construction as a profit instrument, none for 340B, and none for balance billing. Its evidence is hospital price and consolidation data, which is a different question from the three we could not size. The review strengthens the case for the rows we already had and left our four rows exactly as unquantified as they were, which is why we quantified them ourselves. No outside document is going to do it for us.
4A.5a Depth: private equity, and why we carry no dollar figure
Answer first: private-equity extraction from American healthcare is real, and its mechanics are documented by a bipartisan Senate investigation and by peer-reviewed research on price and quality. What does not exist is a defensible national dollar aggregate, so this report asserts none — no estimate, no range, no hedge. The reason no such figure can be built is itself a Finance Committee finding: the federal government does not collect the ownership data it would require. The row is stronger stating the mechanism and the data gap than it would be carrying a number no method reproduces.
Why no aggregate is defensible
Three grounds, in ascending order of seriousness.
One — no institution publishes one. We searched for a published annual estimate of private-equity extraction, value destruction, or private-equity-attributable cost in US healthcare, and found none of national scope: not from the Government Accountability Office, the Senate Budget Committee, the Joint Economic Committee, the California Health Care Foundation, or the peer-reviewed literature in JAMA, the BMJ, Health Affairs or the NBER series. A number no institution publishes and no method reproduces is not a conservative estimate. It is an unsupported assertion, and we do not make one.
Two — the sector is small enough that large aggregates fail a scale check. Private-equity firms own roughly 8 percent of private US hospitals and, on the Government Accountability Office's own estimate, 5 percent of the approximately 14,800 nursing homes enrolled in Medicare in 2022 SOURCED. Against those denominators, consider the flow of capital: private-equity investment into the entire US healthcare economy — service providers, healthcare technology, pharmaceuticals and biotechnology together — peaked at about $83 billion nationally in 2021, and private-equity deals to acquire healthcare service providers totalled $46.9 billion across the whole five years 2019 to 2023 SOURCED, California Health Care Foundation. Deal value is money paid in to acquire companies, which is close to the opposite of extraction, so these figures are not the right comparator for an extraction estimate and we do not present them as one. They are a scale check, and they are why any candidate aggregate in the hundreds of billions must be rejected on its face: it would require owners holding single-digit percentages of facilities to extract several times the sector's peak annual investment inflow — a material share of the entire $5.3 trillion US health economy — every year.
Three, and this is the decisive ground — the mechanism-level and aggregate-level figures in circulation are irreconcilable. Our own itemisation of private-equity fee extraction sits at about $30 billion, an order of magnitude below the aggregates commonly quoted in this debate. Figures that far apart, describing one industry, are not a range. They are an unreconciled gap, and the disciplined response is to publish the mechanism evidence and decline the total.
So we state it plainly: no dollar figure, and none constructed by inference. We do not label anything here ESTIMATED, because ESTIMATED asserts a derivation and there is none to show.
What the evidence actually supports — mechanism, named cases, and identified price effects
The mechanism is leverage, and it is uncontroversial. Acquisition debt is typically loaded onto the acquired company rather than the acquirer: the California Health Care Foundation records that private-equity firms "typically use debt to finance 60-80% of the price of acquisitions, and that debt is then transferred to the entity being acquired" SOURCED. The Joint Economic Committee's minority staff put the same mechanism at "about 70% of the money that PE investors use to buy a company" coming from loans, with "the acquired company" then "responsible for paying off this debt" SOURCED. The consequence is visible in Medicare cost data: Gupta, Howell, Yannelis and Gupta "document a systematic shift in operating costs post-acquisition toward non-patient care items such as monitoring fees, interest, and lease payments" SOURCED. Operating cash is redirected from care to interest and rent. That is the extraction, and it needs no aggregate to be legible.
A bipartisan Senate committee has already documented the mechanics by name and by amount, which matters more before this Committee than any estimate of ours. The Senate Budget Committee's staff report of 7 January 2025, released jointly by Chairman Sheldon Whitehouse and Ranking Member Chuck Grassley after a year-long investigation reviewing more than one million pages of documents, found:
"Despite gross financial and operational mismanagement of its hospitals, LGP took home $424 million of the $645 million that PMH paid out in dividends and preferred stock redemption during LGP's majority ownership—in addition to over $13 million in fees—that left PMH in severe financial distress. In order to pay out these distributions, PMH was forced to take on hundreds of millions of dollars in debt, eventually leading to PMH running out of cash and defaulting on its loans."
"According to the Committee's findings, Lifepoint Health pays Apollo $9.2 million annually just to cover management fees."
SOURCED. Scope discipline: the $424 million is one company across a multi-year ownership period. It is not annual and it is not national, and we do not scale it. Its value is that it is a bipartisan Senate finding naming dividend recapitalisation, management fees and leveraged distribution as the instruments — the three mechanisms the RFI's own private-equity bullets do not name at all.
On patient harm, the strongest published finding is built on Medicare claims and is very hard to explain away. Kannan, Bruch and Song, examining 662,095 hospitalisations at 51 private-equity-acquired hospitals against 4,160,720 at 259 matched controls, report:
"After private equity acquisition, Medicare beneficiaries admitted to private equity hospitals experienced a 25.4% increase in hospital-acquired conditions compared with those treated at control hospitals (4.6 [95% CI, 2.0-7.2] additional hospital-acquired conditions per 10 000 hospitalizations, P = .004)."
"This increase in hospital-acquired conditions was driven by a 27.3% increase in falls (P = .02) and a 37.7% increase in central line-associated bloodstream infections (P = .04) at private equity hospitals, despite placing 16.2% fewer central lines."
SOURCED, JAMA 2023. The two "despite" clauses are the point: harm rose while exposure fell. Central-line infections increased while fewer central lines were placed, and the authors report surgical site infections doubling from 10.8 to 21.6 per 10,000 hospitalisations "despite an 8.1% reduction in surgical volume," while noting explicitly that "statistical precision of the between-group comparison was limited by the smaller sample size of surgical hospitalizations" — a limitation we reproduce because they stated it.
On whether the effect is private equity or merely corporate consolidation, there is a clean answer, and it is the rebuttal we would otherwise face. La Forgia and colleagues, using 2,255,933 anaesthesia claims across 672 facilities contracting with physician-management companies against 2,992 that never did, separate the two:
"In subsample analyses, PMCs without PE investment increased allowed amounts by 12.9% (+$89.88; 95% CI, $42.07 to $137.69; P < .001), while PE-backed PMCs (representing half of the PMCs in the sample) increased allowed amounts by 26.0% ($187.06; 95% CI, $133.59 to $240.52; P < .001)."
SOURCED, JAMA Internal Medicine 2022. Twenty-six percent against 12.9 percent isolates the private-equity effect from the general corporate-consolidation effect. Whatever corporate management companies do to price, private-equity-backed ones did roughly twice as much of it.
The systematic review, including the part of it that does not help us. Borsa, Bejarano, Ellen and Bruch screened 1,778 studies and included 55, across eight countries, with formal risk-of-bias assessment:
"Across the outcome measures, PE ownership was most consistently associated with increases in costs to patients or payers. Additionally, PE ownership was associated with mixed to harmful impacts on quality. These outcomes held in sensitivity analyses in which only studies with moderate risk of bias were included. Health outcomes showed both beneficial and harmful results, as did costs to operators, but the volume of studies for these outcomes was too low for conclusive interpretation. In some instances, PE ownership was associated with reduced nurse staffing levels or a shift towards lower nursing skill mix. No consistently beneficial impacts of PE ownership were identified."
SOURCED, BMJ 2023. We quote the inconclusive sentence as well as the damning ones. The review's own position is that the health-outcome and mortality evidence base is too thin for a conclusive reading. Anyone citing this review for a mortality claim is citing it against its own caution.
And the contrary result, which we raise ourselves. Dixit, Philips, Trivedi, Whaley and Singh, using a 20 percent Medicare Part B sample and 24,397 beneficiaries whose primary care physicians were acquired by private equity against 121,939 matched controls, found no harm in acute-care outcomes:
"In this national study of traditional Medicare beneficiaries, PE acquisitions of primary care practices were not associated with meaningful short-term changes in acute care outcomes. Overall, findings contribute to policy discourse on understanding the role of PE investments in shaping care quality, suggesting heterogeneity in outcomes across health care settings."
SOURCED, JAMA Health Forum 2026. The honest state of the literature is heterogeneous by setting — adverse in hospitals and nursing homes, adverse on price in specialty practices, null on short-term acute outcomes in primary care. We state that ourselves rather than have it produced against us, and it is also the reason a single national extraction total would be the wrong instrument even if one existed: the effects are setting-specific and the policy response should be too.
A mortality figure that requires precision, and gets it here. The nursing-home literature contains a frequently-quoted estimate of 20,150 lives lost to private-equity ownership. That figure belongs to the working-paper version of Gupta, Howell, Yannelis and Gupta, where it accompanies a 10 percent short-term mortality increase and is cumulative over a twelve-year sample period, not annual. The revised abstract of the same work reports an instrumented local average treatment effect on mortality of 11 percent and describes the overall effects as "nuanced, with adverse outcomes for a subset of patients." We therefore attribute the 20,150 figure to the working paper, state its twelve-year basis, and do not annualise it. A submission that quotes it as an annual toll, or attributes it to the journal article, can be corrected in one sentence by anyone holding the published text.
The recommendation this produces, and it is within this Committee's jurisdiction
The reason no credible national total exists is itself the finding, and it is a Finance Committee problem. The Government Accountability Office, examining nursing-home ownership, reported that "CMS's data do not provide a means of readily identifying private equity firms and were not designed to do so," and that "many nursing homes—including those that were private equity-owned and those that were not—did not have all of their owners listed in CMS's data" SOURCED, GAO-23-106163. The ownership data required to compute an extraction total is not collected. That is why no defensible national aggregate exists, from us or from anyone else.
So the ask is not a number. It is the register that would let anyone produce one:
- Beneficial-ownership reporting as a condition of Medicare and Medicaid participation, identifying controlling investors and fund families rather than only immediate corporate parents — a conditions-of-participation matter, squarely within this Committee's Medicare and Medicaid jurisdiction.
- Reporting of related-party payments — management fees, monitoring fees, interest to affiliated lenders, and rent to affiliated landlords — as distinct line items on the cost reports providers already file. This is the exact category the Medicare data shift toward "monitoring fees, interest, and lease payments" describes, and it is currently invisible.
- Sale-leaseback and dividend-recapitalisation disclosure for facilities drawing Medicare or Medicaid payment, which the RFI's own ownership-database bullet gestures at without naming either instrument.
So what? The RFI raises private equity in three bullet points with the softest ask verb in the document, and names none of the three mechanisms by which the money actually leaves. "Roll-up," "sale-leaseback" and "dividend recapitalisation" appear zero times in 86 pages. We cannot say how large the channel is. We can say precisely how it works, that a bipartisan Senate investigation has already documented it working, and that the federal government cannot currently see who owns the facilities it pays.
4A.5b The $306 billion hospital figure: what it is, and how it is built
Answer first: $306 billion is an estimate of what commercial payers pay hospitals above Medicare-equivalent rates. It is one quantity, not the sum of four separate components — the four hospital mechanisms in Exhibit 6 overlap, so adding them would count the same dollars more than once. An independent reconstruction from published inputs alone lands about 10 percent above the figure, and the method is set out below so that a reader can check it.
Why the components are not additive
The four hospital mechanisms are facility-fee and site-of-service arbitrage ($95B), for-profit hospital net income ($85B), nonprofit hospital operating surplus ($65B), and hospital supply-chain and group-purchasing markups ($61B). They are not mutually exclusive, so a sum of them would measure less than it appeared to. Three overlaps, each material:
- Facility-fee arbitrage is largely inside commercial price. The commercial-to-Medicare multiple this report relies on covers "all hospital inpatient and outpatient services (including both facility and related professional claims)" — and outpatient facility services, at 279 percent of Medicare, are precisely where facility-fee differentials are realised. Counting the outpatient multiple and the facility-fee differential as separate quantities counts the same dollars twice.
- Market power is a cause of excess price, not an addition to it. RAND's finding is that hospital market power explains commercial price variation. Consolidation-driven increases are therefore already inside the excess-over-Medicare measure. This is the same reason the $75 billion consolidation premium was already excluded from the headline (Note 1 above), applied consistently.
- Net income and operating surplus are funded out of price; they are not levied on top of it. A hospital's surplus is what remains after costs from the revenue its prices generate. Adding surplus to excess price sums a use of funds to a source of funds. The same objection defeats any attempt to add hospital administrative expense: total hospital administrative expense has been measured at $166.1 billion, 17.0 percent of total hospital expenses SOURCED, and it is a cost category paid for out of prices — which is why this report does not add it, and does not treat that published figure as an extraction component. The authors of that measurement are explicit that available data cannot separate excess administration from necessary administration.
Any submission built on a single large number should expect exactly this examination of its scope, and it is cheaper to conduct it on oneself than to have it conducted for you.
The construction, with the method shown
$306 billion is therefore one quantity: commercial hospital prices in excess of what Medicare would have paid for the same services. The four mechanisms are carried in Exhibit 6 as the routes by which that excess is realised and captured — site-of-service billing, for-profit distribution, nonprofit accumulation, supply-chain markup — and are not added together.
Here is the independent reconstruction, from published inputs only, so that a reader can check the magnitude without accepting our model:
| Step | Value | Source |
|---|---|---|
| Total US spending on hospital care, 2023 | $1.5 trillion | KFF, from the CMS National Health Expenditure Accounts |
| Private health insurance share of hospital care spending, 2023 | 37 percent (Medicare 25 percent, Medicaid 19 percent) | KFF, same source |
| Commercial hospital spending, 2023 | ≈ $555 billion | 0.37 × $1.5 trillion |
| Commercial prices as a share of Medicare-equivalent prices, 2022 | 254 percent | RAND, Round 5.1 national average across inpatient and outpatient facility and professional services |
| Implied share of commercial hospital spending above Medicare-equivalent rates | 60.6 percent | (254 − 100) ÷ 254 |
| Implied excess over Medicare-equivalent rates | ≈ $336 billion | 0.606 × $555 billion |
That reconstruction lands roughly 10 percent above our $306 billion, using nobody's numbers but KFF's and RAND's. It is ESTIMATED, not SOURCED18: the multiplication is ours, and it carries five limitations we state rather than bury.
- Mixed vintages. The payer shares are 2023, the price multiple is 2022, and the current hospital-care total is 2024 ($1.6 trillion). We use the 2023 base for internal consistency with the 2023 payer split.
- The price multiple is not nationally representative. It is drawn from twelve state all-payer claims databases plus self-insured employers — $77.4 billion of spending across more than 4,000 hospitals, which is large but not a random national sample. RAND itself reports state-level results ranging from below 170 percent to above 300 percent, so a single national multiple carries real error.
- The two denominators are not perfectly aligned. RAND's measure includes related professional claims; the national accounts' "hospital care" category is constructed differently.
- "Above Medicare rates" is not automatically "extraction." This is the substantive objection and it is answered in full at 4A.5d rather than assumed away here.
- The reconstruction is not additive with anything else in Exhibit 6. It substantially subsumes facility fees and consolidation effects, for the reasons given above.
What this figure is, and what it is not
Our own prior model does contain $306 billion as an output for hospital extraction. That is internal consistency, not external validity, and we will not present it as corroboration. Two of our own documents agreeing tells a reader nothing about whether the number is right. What the reconstruction above establishes is different and weaker in one respect and stronger in another: it shows that a figure of this order can be built from published inputs alone, and that the excess-over-Medicare measure by itself approximately accounts for the whole. A total that a single one of its candidate parts can reproduce is not a sum of parts.
We therefore label it ESTIMATED, state the method above wherever the figure carries weight, and invite the Committee to test the arithmetic. No comparable published estimate of hospital extraction exists; if the Committee has one, we would rather be corrected than cited.
4A.5c The $95 billion site-of-service line, and the published figure that does not support it
Answer first: the mechanism is real, published and quantified by the Medicare Payment Advisory Commission. The magnitude we carry is not. The only published site-neutral savings figure we could verify is Medicare-only, restricted to low-complexity services, and statutorily budget-neutral — which makes it neither support for our $95 billion nor a refutation of it. We say so rather than borrow its authority.
The mechanism is not in dispute. RAND's own data show it: common outpatient services performed in ambulatory surgery centres "averaged 171 percent of Medicare prices but would have averaged approximately 107 percent of Medicare prices if paid using Medicare payment rates for hospital outpatient departments" SOURCED. The same service, priced two ways, differing by roughly a factor of 1.6 within Medicare's own rate structure.
The scope mismatch, stated plainly. MedPAC's published estimate of savings from site-neutral payment — approximately $7.5 billion, on 2021 data — differs from our $95 billion in three ways, each of which matters:
- Payer. MedPAC's estimate is confined to the Medicare programme. Our line is all-payer, and commercial prices run at multiples of Medicare's, so the two cannot be compared without a conversion neither of us has published.
- Service breadth. MedPAC's estimate covers a defined set of low-complexity services where clinical equivalence across settings is least contestable. Ours is not so restricted.
- Budget treatment. MedPAC's site-neutral proposals are constructed to be budget-neutral within Medicare by statute and convention, meaning the savings are redistributed rather than removed from the programme. Ours is a gross measure of a differential, not a net fiscal score.
Because of those three differences we do not cite the $7.5 billion figure as support for the $95 billion, and a reader should not read it as one. It establishes that the mechanism is real, published and quantifiable by a federal advisory body. It does not establish our magnitude, and the line is labelled ANALYST in Exhibit 6 accordingly — our own judgement of an all-payer differential, not a published measurement.
Two figures this section does not use, and why. An 87 percent facility-fee differential is widely quoted in this debate and traces to the Health Care Cost Institute; we could not confirm it at source, so it carries no SOURCED35 label here and the anchoring comparison is RAND's ambulatory-surgery-centre finding above. We cite no Congressional Budget Office figure either: the ten-year site-neutral score commonly quoted sits behind an access control that defeated automated retrieval, and we do not cite figures we have not read.
None of this weakens the finding that matters. The finding is that "facility fee" and "site of service" appear zero times in 86 pages, that the differential is a Medicare payment-policy question squarely inside this Committee's jurisdiction, and that MedPAC has been recommending action on it for years. A magnitude held with candid uncertainty does not make the absence any smaller.
4A.5d The benchmark objection: why "above Medicare" is not automatically "extraction"
Answer first: this is the strongest objection to our largest number, and it deserves an answer rather than a footnote. Medicare pays the average hospital below its average cost. Measuring excess against Medicare rates therefore embeds a counterfactual — that hospitals could operate at Medicare rates system-wide — which the Medicare Payment Advisory Commission's own data do not support for the average hospital. We answer it three ways, and we concede what has to be conceded.
State the objection at full strength. MedPAC reports that "exclusive of coronavirus relief funds, hospitals' FFS Medicare margin was stable (from –13.1 percent to –13.0 percent)" in FY 2023, and projects it stable at about –13 percent for 2025 SOURCED. If the average hospital loses 13 percent on Medicare, then treating the entire commercial amount above Medicare rates as extraction assumes away a genuine shortfall. That objection is legitimate and we do not dismiss it.
First answer: the aggregate margin is substantially a cost phenomenon, and MedPAC says so in the same breath. The sentence continues:
"Nonetheless, some hospitals—which we refer to as 'relatively efficient'—consistently achieved lower costs while still performing relatively well on a specified set of quality metrics. The 2023 median FFS Medicare margin among these relatively efficient hospitals was –2 percent, exclusive of coronavirus relief funds. For 2025, we project that hospitals' FFS Medicare margin will remain stable at about –13 percent. Similarly, we project that the median FFS Medicare margin among relatively efficient hospitals will remain stable at about –2 percent."
SOURCED. The eleven-percentage-point gap between –13 percent and –2 percent is a cost-structure gap, not a Medicare-rate gap — and it is measured among hospitals that MedPAC certifies as performing well on quality, which forecloses the reply that the efficient cohort is simply cutting care. This report's rule, applied from here on: the –13.0 percent figure never appears without the approximately –2 percent median beside it. Quoting the aggregate alone hands the strongest available talking point to the sector we are examining; quoting both converts the same data into evidence about cost structure.
Second answer: Medicare's marginal profit is positive. MedPAC: "We estimate that hospitals' marginal profit on inpatient and outpatient services provided to FFS Medicare beneficiaries remained positive in FY 2023. This finding suggests that most hospitals continued to have a financial incentive to serve FFS Medicare beneficiaries" SOURCED. A negative average margin with a positive marginal profit means Medicare covers the incremental cost of the next Medicare admission, and the negative average reflects allocated fixed and overhead cost. Hospitals are not losing money on the next Medicare patient.
Third answer: all-payer profitability is healthy and improving without relief funds. MedPAC reports the all-payer operating margin rising "to 5.1 percent in 2023, up from 2.7 percent in 2022," and the all-payer total margin at 6.4 percent, up from 2.3 percent — an improvement that "occurred despite a decrease in coronavirus relief funds," from about $9 billion in 2022 to about $3 billion in 2023 SOURCED. MedPAC also records the dispersion, which we reproduce because it constrains any blanket remedy: "A quarter of hospitals had an all-payer operating margin below –4 percent, while another quarter had a margin above 10 percent. The majority of hospitals had a positive operating margin" SOURCED.
What we concede, and what it costs the number. We concede that a fully defensible excess measure would net out legitimate cost recovery, and that doing so would reduce our figure. The most defensible benchmark available is not the aggregate –13 percent but the relatively-efficient –2 percent — the cost level MedPAC finds achievable with good quality performance — and against that benchmark the netting-out is small rather than large. We have not published a netted figure, because doing so would require a hospital-level cost model we do not have. So the honest statement is that $306 billion is a gross excess-over-Medicare measure, that the net figure is smaller, and that the difference is bounded closer to two percentage points than to thirteen. We would rather state that than quietly choose the benchmark that flatters us.
4A.6 Depth: stock buybacks and executive compensation
Answer first: the RFI proposes real restrictions here, not just disclosure — and it aims them at the wrong thing. Buyback and pay limits govern what a company does with profit it has already taken. What reaches care is decided when the money is taken, not when it is spent. Our verdict: capping shareholder return is the wrong target. Leave capture untouched and the money simply goes somewhere else — no extra dollar reaches a patient.
First, credit where it is due — on this item the RFI proposes to constrain, not merely to disclose. p072 does not ask for a reporting regime. It asks for restrictions:
"Policymakers have restricted the ways some for-profit companies can use or invest taxpayer dollars, such as by taxing or restricting stock buybacks, and researchers expressed support during listening sessions for similar limitations on health insurance companies, including limiting executive compensation, or limiting investment of taxpayer funds to domestic health care activities that provide a demonstrated public benefit. Senate Democrats request feedback on these proposals." (p072) SOURCED
Footnote 313 supplies the precedents: conditions on taxpayer funding to banks under the Emergency Economic Stabilization Act of 2008 and to airlines under the CARES Act of 2020. SOURCED. These are real enacted constraints, and any critique claiming the RFI "only discloses" here would be wrong on the facts. The ask verb is mid-strength too — "request feedback" — not the softest in the document.
Second, how it gets worked around. None of this is exotic evasion; it is ordinary corporate finance. Section 11.17 lists these at proposal level. The point here is that each one is cheap and fast:
- Buyback-to-dividend substitution. The RFI's own evidence shows the two are already reported together — "Cigna spent over $5 billion on stock buybacks and dividends" (p072). A buyback restriction that does not reach dividends redirects the same cash through the other channel in one quarter. Volume 2 measures $45B buybacks against $20B dividends in the insurer segment; the dividend channel has ample headroom.
- Timing around reporting periods. The RFI notes UnitedHealth "plans to initiate stock buybacks earlier in 2026 than anticipated" (p071) SOURCED — evidence that buyback timing is already an actively managed variable.
- Compensation restructured into deferred, equity, or subsidiary-level vehicles. The RFI's own citation is instructive: footnote 310 references a UnitedHealth CEO arrangement described as a base salary plus a substantially larger equity award. A cap keyed to reported compensation is satisfiable by shifting form. ANALYST: the historical record on §162(m) and on TARP compensation limits is that form-shifting dominates level-reduction.
- Activity shifted to an unregulated affiliate. A restriction scoped to the licensed insurance entity does not reach the parent or a non-insurance subsidiary. This is the perimeter problem of Section 6.5, recurring in the capital-structure domain.
Third, the harder question, and our call. Is capping shareholder return the right target at all?
No. Three reasons.
- Where the profit goes is not where the profit was taken. A premium dollar that does not reach care has already failed the test at the moment the company keeps it. Spending it afterwards on a buyback, a dividend, an acquisition, a cash reserve or a data centre changes neither the numerator nor the denominator of the care-dollar ratio. Volume 2 makes the same point in its accounting note: buybacks and dividends "represent how profits are distributed, not additional extraction."
- A cap on payouts without a cap on capture moves the money and can make things worse. If retained profit cannot go to shareholders, the next-best use is buying things — providers, PBMs, care-management businesses, analytics subsidiaries. That is exactly the vertical integration the RFI diagnoses at p074-p076. ANALYST, and this is the sharpest form of the objection: a buyback restriction with no capture constraint attached pays insurers to buy the very affiliates that transfer pricing runs through. The cure funds the disease.
- The figures do establish the subsidy-conditionality argument, and that is what they are good for. $54B profit (p070), nearly $150M collective CEO compensation, Cigna's $5B against a $51M package, CVS's $3B against $23M (p072) legitimately support the argument that taxpayer support exceeding $500B annually justifies conditions (p071). SOURCED. They do not establish anything about the care-dollar ratio, which is a separate question answered in 11.17.
Recommendation, extending Section 11.17 rather than repeating it: turn the buyback proposal from a ban into a condition. Make eligibility for federal subsidies and participation in federal markets depend on hitting a care-dollar-ratio floor measured across the whole consolidated group. That borrows the RFI's own penalty idea from p079, aims at capture instead of payout, and turns the most gameable item in Section 3 into the enforcement arm for the least gameable ones.
This does not contradict Section 11.17. It explains why 11.17's verdict is right: buybacks rate MARGINAL on Axis 1 not because the dollars are small but because the whole mechanism sits one stage too late — after the care-dollar ratio has already been set.
4A.7 Depth: hospital lock-in arbitrage, and a counterintuitive finding about network adequacy
Answer first: the RFI never diagnoses hospital lock-in arbitrage at all, and our hypothesis that network adequacy rules may strengthen it HOLDS — subject to one important qualification the RFI itself supplies and then fails to generalise. This is a real finding that one of the most popular remedies in the document makes effective access WORSE on Axis 2.
The mechanism. A must-have health system — an academic medical centre, the only tertiary facility in a region, a system holding the dominant share of specialists — can extract above-market rates because no insurer can sell a product that leaves it out. The system's leverage has nothing to do with efficiency, quality or scale. It is the ability to say, credibly, that a network without us cannot be sold. No consumer-facing transparency remedy can see this pricing power, because the patient never sees the negotiated rate, cannot pick a different tertiary centre, and meets the result only as a higher premium. Rate review of the insurer cannot see it either: the insurer's filing truthfully attributes the increase to medical cost trend. The filing is accurate, which is precisely why reviewing it harder changes nothing.
What the RFI has. Three relevant bodies of content, read carefully:
- Network adequacy (p047-p048). The RFI's posture is unambiguously inclusionary: "Federal policies should incentivize broad networks of high-quality providers" (p047); the Trump administration's 2027 NBPP proposal to eliminate "the federal floor and oversight of network adequacy requirements that require plans to contract with a sufficient number of providers" is criticised (p047); advocates propose "codifying stronger requirements to contract with a minimum number of providers" (p048). SOURCED. Every network proposal in the RFI increases the plan's obligation to include providers. Not one constrains what an included provider may charge.
- Rate review (p019-p021). Directed entirely at the insurer. The RFI's own diagnosis is that plans "are rarely required by state or federal regulators to meaningfully demonstrate that the cost increases they are imposing on consumers are justified" (p019) SOURCED. The remedy is better interrogation of the insurer's justification. If the justification is a genuine must-have-system rate increase, a more rigorous review confirms it rather than preventing it.
- Provider consolidation. Zero mentions, as established in 4A.3.
Does the strengthening hypothesis hold? Yes. The argument, ANALYST throughout:
- A network adequacy floor converts commercial necessity into regulatory necessity. Before the rule, the insurer cannot profitably exclude the must-have system. After the rule, it cannot lawfully exclude it if exclusion would breach the adequacy standard in that service category or geography.
- Walking away is the insurer's only credible threat. Take the threat away and the hospital can charge more. That is first-week bargaining theory, and it works whatever anyone intended.
- "Removal of repeat offenders from certain markets" (p048) as a ghost-network penalty compounds it: the plan faces escalating penalties for directory inaccuracy and network insufficiency, which raises the cost of failing to contract, which further weakens its position opposite the party it must contract with.
- The result passes straight through. The insurer accepts the rate, files it in the next rate submission as medical trend, and the premium rises. Axis 1 NEUTRAL — the money moves from premium to provider, not to insurer margin, and not to additional care. Axis 2 nominal IMPROVES: the network is broader on paper. Axis 2 effective INDETERMINATE and plausibly WORSENS: coverage that is wider and less affordable is not obviously better coverage for the marginal enrollee. Axis 3 HIGH.
The qualification, and it is a real one. The RFI holds the answer and does not generalise it. At p031, describing Washington's Cascade Select public option:
"the state legislature and capped at 160 percent of Medicare, with the legislature able to make additional downward adjustments to payment rates. Hospitals are required to contract with at least one Cascade Select plan, though the plan has experienced challenges establishing broad networks." (p031) SOURCED
This is the right structure, and it appears exactly once in 86 pages. It puts a must-offer obligation on the hospital and a ceiling on the rate. It places the duty on the party with the pricing power instead of the party being priced. Note also the RFI's own honest reporting that even with that pairing "the plan has experienced challenges establishing broad networks" and that Washington's "initial premium reduction targets... have not been met" (p031) SOURCED. That is evidence that hospital resistance to rate discipline is what binds — the finding sitting in plain sight that the document never draws.
We are not saying abandon network adequacy, and we should say why rather than get caught overstating. First, the counterfactual matters: the RFI is defending an existing federal floor against repeal, and repeal gives you narrower networks with the same hospital pricing power behind them — worse on both axes. Defending the floor is right. Second, the harm depends on market structure; where provider markets are competitive, an adequacy floor barely shifts the bargaining. So the finding is: network adequacy floors help effective access in competitive provider markets and range from ambiguous to harmful in concentrated ones, and the RFI proposes one national standard that does not tell the two apart.
Reconciliation with Exhibit 1. Exhibit 1 rates proposal 2.2 as Axis 1 NEUTRAL, Axis 2 IMPROVES, Axis 3 HIGH. We are not overturning that rating. We are supplying the mechanism behind the HIGH and sharpening the Axis 2 entry. Read the Axis 2 rating as IMPROVES nominal / INDETERMINATE effective in concentrated provider markets, using the same nominal-versus-effective split Section 2.2 already puts at the centre of the axis. Recommended amendment: annotate 2.2 in Exhibit 1 rather than change the headline rating, because in competitive markets IMPROVES is correct.
Recommendation for the submission. Propose what p031 already does and the RFI never repeats: attach to any federal network adequacy floor either a rate ceiling or a must-offer obligation on the provider in designated concentrated markets. Without that pairing, the adequacy floor hands money from premium payers to must-have hospital systems — and it will show up in the data as a premium increase caused by a Democratic consumer-protection rule.
4A.8 Why: jurisdiction, tested and largely rejected
Answer first: jurisdiction explains part of this, and it does not explain the three biggest absences. All three sit largely inside Senate Finance's own tax and Medicare jurisdiction. The Committee could have written about them. What fits the evidence better is the asymmetry Exhibit 6 records between who is diagnosed and who is not.
Give jurisdiction its full due. Senate Finance's jurisdiction runs to Medicare, Medicaid, and the tax code — not to antitrust, not to the Public Health Service Act, not to the general regulation of provider markets. The RFI also explicitly places itself in a series, "the second in a series of long-term projects... following a June 2026 RFI focused on lowering prescription drug prices" (p004), and explicitly disclaims completeness: "not intended to be an exhaustive summary" (p002). SOURCED. Both scoping acknowledgements are genuine and both are stated in the document's own voice. A critique that ignored them would be unfair.
Now the test. If jurisdiction explains the omissions, the absences should cluster outside Finance's authority. They do not.
| Absence | Primary instrument | Committee jurisdiction | Does jurisdiction explain it? |
|---|---|---|---|
| Facility fee and site-of-service arbitrage ($95B, ANALYST — scope stated at 4A.5c) | Medicare OPPS vs physician fee schedule payment differential; site-neutral payment | Finance, squarely | No |
| Nonprofit hospital tax exemption vs charity care delivered ($28B) | Internal Revenue Code §501(c)(3) and §501(r) community-benefit standards | Finance, squarely — this is literally the tax code | No |
| Medicare Advantage overpayment, total ($76B; ~11 pts favourable selection, ~4 pts coding intensity) | Medicare risk-adjustment methodology | Finance, squarely | No |
| Nonprofit hospital executive compensation | §4960 excise tax on excess tax-exempt compensation | Finance | No |
| For-profit hospital net income and nonprofit surplus ($150B) | Medicare payment policy; corporate tax | Finance, substantially | Partly |
| Private equity structures (no dollar figure; see 4A.5a) | Carried interest, interest deductibility, REIT treatment; beneficial-ownership and related-party reporting as conditions of participation | Finance, substantially | Partly — and the RFI does raise PE, weakly |
| Hospital consolidation and market power | Clayton Act enforcement | Judiciary | Yes |
| 340B arbitrage | Public Health Service Act §340B | Energy and Commerce / HELP | Yes |
| Hospital supply chain and GPO markups ($61B) | Anti-kickback safe harbour; FTC | Mixed; Finance has purchase | Partly |
Jurisdiction explains two absences cleanly — antitrust and 340B — and explains none of the three biggest. Site-neutral payment reform is a Finance bill. §501(r) community-benefit enforcement is a Finance bill. Risk-adjustment reform is a Finance bill. The RFI's biggest omissions are not beyond its reach. They are inside it. ANALYST.
There is a further internal inconsistency. The RFI treats private insurance as its subject, yet repeatedly reaches into Medicare for comparison and precedent: Medicare pricing as the benchmark (p019, p071), Medicare Advantage ghost-network legislation as precedent (p048), Medicare administrative contractors as a model for conflict-free TPAs (p083), Medicare-X and Part E buy-in (p033-p037). SOURCED. A document that uses Medicare as benchmark, precedent, model and product cannot then say Medicare risk-score inflation was out of scope.
4A.9 Why the omission is total: the frame does the work
Answer first: the document's coverage does not track where the money is, and the correlation that does hold is between who gets diagnosed and who appears as an ally. We state it as an observation about structure, not as an accusation about motive.
ANALYST: we do not need to claim anyone left hospitals out on purpose. The plain observation is stronger and harder to rebut: everyone this document names as an extractor is absent from its coalition, and everyone in its coalition goes unnamed as an extractor. The correlation holds without exception across Exhibit 6 — insurers, insurer affiliates, TPAs, repricers and private equity get diagnosed; hospitals, health systems and physician organisations are allies or victims throughout. By our numbers the document spends about 98 percent of its pages on a channel holding 24 to 32 percent of measured extraction.
This composes with the victim frame in 4A.4b. 4A.4b shows the mechanism of the omission: once hospitals enter the text as the party things are done to, no sentence remains in which they set a price. Neither finding requires anybody to have suppressed anything, and neither depends on the other. The frame does the rest of the work automatically, page after page, which is why the absence is total rather than partial — a document does not have to keep deciding to leave something out once its grammar has already decided. How a frame with that shape comes to be adopted is a separate question, and this memorandum does not take it up. The case here rests on the mechanism, which is observable in the document's own sentences.
4A.10 Consequences, tested
Consequence 1 — squeeze insurer margin and it comes back downstream. Do the RFI's proposals stop that or just move it? Mixed — and we can say which is which, proposal by proposal.
The RFI is not naive here, and Section 6.5 covers its treatment in detail. It names the mechanism at p076: insurers can take "the excess dollars as profit in another affiliated non-insurance subsidiary of the same company." SOURCED. Three of its proposals actually hold — benchmarking affiliate payment rates to unaffiliated rates (p075-p079), limiting the share of intercompany transfers reportable as medical spending (p076), and disallowing internal markups from MLR (p079) — because each one bites on the transfer itself rather than on the entity's reported margin. The rest just move the money. Buyback caps move it to dividends and acquisitions (4A.6). Higher MLR thresholds move it into affiliate transfer pricing (Section 7.5). Rate review moves it into provider rate increases the insurer can document as real trend (4A.7). Full treatment: Section 4B and Exhibit 7.
The route nobody has closed is the one our taxonomy exposes: the money moves along the chain to actors this document does not regulate at all. Nothing in the RFI stops a hospital rate increase, a facility-fee differential, or a supply-chain markup. And an insurer living under a hard fee-per-member cap has less reason to fight provider rate demands, because its own administrative and profit take is now fixed by rule and no longer grows with medical spending. ANALYST: the fee-based cap at p079 — which we rank as the second-most-valuable lever in this report — removes the insurer's reason to negotiate hard on hospital prices. That is not a reason to drop it. It is a reason to pair it with price discipline on the provider side, and the RFI offers no such partner.
Consequence 2 — costs keep climbing and premiums keep rising, so the package can deliver a measurable nothing on the number the public tracks.
Commercial premium growth is driven substantially by provider prices, and the RFI cites the evidence three times (p019, p034, p071). If the next reform enacts the insurer-scoped package and provider pricing power is untouched, the observable outcome is: administrative reporting improves, denial procedures improve, MLR compliance improves, and premiums keep rising. ANALYST: every reported indicator moves in the intended direction while the quantity the package was meant to change does not. Section 7.5 shows the same trap in narrow form — raising the MLR threshold without first fixing affiliate transfers — and the generalisation is that the whole package can pass its own compliance tests and still leave the premium on its existing trajectory. The Committee has every reason to want that established before drafting rather than after enactment.
Consequence 3 — chronically ill patients are harmed most by exactly what is missing.
Section 9 establishes the verified zero counts: long COVID 0, ME/CFS 0, chronic illness 0, post-viral 0, one occurrence of "chronic" in any form across 86 pages (p051). The framing indictment compounds that finding rather than repeating it. Continuous multi-specialty need means continuous exposure to precisely the mechanisms in Exhibit 6's ABSENT rows: facility fees on every recurring outpatient encounter (M13a, $95B); site-of-service differentials on infusion, imaging and procedures (M13a); out-of-network specialists where the needed subspecialist is in one system (M14, M18); and consolidated-system pricing where the must-have academic centre is the only place a contested diagnosis is competently managed (M14).
ANALYST: a patient with three chronic conditions and eleven specialist visits a year meets provider-side and intermediary extraction at every single visit, and insurer denial at some of them. An insurer-only remedy does least for the patients who need most — the same conclusion Section 9.4 reaches from the axis analysis, reached here from the taxonomy. Two independent routes to the same answer, which makes both stronger.
So what? The Committee is right about insurers and right that its own standard demands "every industry in the health care sector" (p004) — and it covers 24 to 32 percent of measured extraction, leaving $382 billion a year alone. We should not ask the Committee to pick a bigger fight. We should hand it the coverage matrix, name the dollars sitting outside its perimeter, and insist the success metric be the care-dollar ratio rather than insurer margin — because insurer margin can be crushed while the care-dollar ratio does not budge, and Section 4B shows exactly how.
4B. Why capping insurer margins moves the money instead of saving it, and what would not
Answer first: cap margin in one place and the same profit gets taken somewhere else. Integrated and adjacent companies restructure; the accounting location changes and the amount does not. For 34 of the RFI's 71 rated proposals we can name where the money would go. Four design principles separate a real reform from a rerouting — perimeter completeness, chain completeness, simplicity as enforcement infrastructure, and transparency as precondition. Exactly three of the RFI's proposals meet all four, and those three carry the weakest asks in the document.
Section 4A showed the RFI's perimeter is too narrow. This section shows what happens because it is too narrow, which is the more useful claim: a narrow perimeter does not merely miss the extraction outside it. It pushes extraction there.
4B.1 The general law
Cap margin on one link of a payment chain and the total extracted does not fall. Only the place it gets booked changes. The cap is real. Changing the accounting is cheaper than changing the behaviour, so the accounting changes.
This needs no conspiracy and no unusual cleverness. It needs only that (a) the regulated company has affiliates, adjacent counterparties, or things it can relabel, and (b) the rule covers less ground than the money can. Both hold throughout the RFI, and the RFI documents condition (a) at length itself (p074-p076).
We call it the waterbed principle because that is what it looks like: push down in one spot and the same volume rises somewhere else. So the question to ask of every proposal is not "does this cut margin at the regulated entity?" It is "where does the margin go?" If we can name the destination, the proposal is not a reform. It is a rerouting.
One piece of evidence establishes the principle better than any of the five precedents below, and it is sitting in our own Exhibit 6. The largest single extraction line in the taxonomy is $76 billion of total Medicare Advantage overpayment (M16) SOURCED42 — MedPAC's projection for 2026 of what MA costs above what the same beneficiaries would cost in traditional Medicare, decomposed by MedPAC into roughly 11 percentage points of favourable selection and about 4 points of coding intensity. It happens inside a public programme, run by a public payer, under public rules. The decomposition strengthens the point rather than weakening it. Coding intensity is at least conduct: somebody chose to record the diagnosis. Favourable selection is not conduct at all — it is an artefact of risk-adjusted payment design, money that moves because of how the formula is written. The larger half of the largest number in the taxonomy owes nothing to ownership form, and could not be reached by any rule about who owns the plan. If the biggest number in the taxonomy does not require a for-profit insurer to be the payer, then extraction is a property of the payment structure, not of who owns the entity. ANALYST. That is the waterbed principle stated at its most general: regulate an owner type and the mechanism moves to another owner type, because the mechanism was never the ownership. The external structured review discussed in 4A.4c reaches the same reading of the same figure by a different route — it treats public-programme overpayment as the decisive inconsistency against an insurer-conduct-only diagnosis. Two analyses, one number, one conclusion: the target has to be the structure.
4B.2 The three relocation routes
Route 1 — VERTICAL: margin moves to an affiliate outside the rule's perimeter
Insurer margin becomes provider-arm margin, PBM margin, care-management-services margin, or analytics-subsidiary margin. Nothing about the underlying activity changes; the invoice is booked in a different legal entity.
This route matters more than the other two, because one move defeats three instruments at once. Section 6.5 covers the RFI's treatment in detail and should be read alongside this section. The core point is that transfer pricing beats MLR floors, rate review and profit caps all at the same time and all in the same direction, without anyone changing what they actually do. Rate review sees real higher insurer costs. MLR sees real higher medical spending. The profit cap binds on a number the profit has already left. Every instrument reports success.
The RFI's own evidence establishes both the scale and the incentive. Intercompany eliminations accounted for approximately one third of UnitedHealth Group's total revenue in 2025 (p075) SOURCED. UnitedHealth pays its own physician groups 17 percent more than unaffiliated ones (p073, fn 319) SOURCED. And the RFI states the causal chain outright: "MLR applies only to the insurance entity rather than the parent company, which has created unintended incentives for insurers to expand into provider, PBM, and pharmacy markets to maximize profits and avoid rebate obligations" (p077) SOURCED.
That sentence is the waterbed principle, written by the Committee. A margin rule built the conglomerates. The RFI records it as a historical note about MLR and never asks the obvious next question about the rest of Section 3, every item of which is scoped to the same entity.
Route 2 — HORIZONTAL: reclassify the same activity into a favourably-treated category
Same company, same activity, different line on the ledger. Utilization management booked as quality improvement. Administrative cost booked as medical expense. This is the cheapest and fastest route — weeks, not contracting cycles — because nobody has to reorganise anything or persuade a counterparty.
The RFI catches this route in the act, and is unusually candid about it. Quality-improvement classifications are "vague" and have absorbed "untargeted provider bonuses, general marketing, overhead and lobbying," reaching "hundreds of millions of dollars each year" (p078) SOURCED. It further reports that plans "use strategies to overstate their medical spending" (p079) SOURCED.
The RFI's answer to this route — barring UM from QIA (p078) — is the best-designed proposal in the document, because it shuts a relabelling channel with a bright line and needs nothing more than a 45 CFR Part 158 rulemaking. Exhibit 1 rates it STRONGLY POSITIVE / IMPROVES / LOW. It carries "invite feedback."
Route 3 — CROSS-CHAIN: pass the squeeze to a link that is not regulated at all
Squeeze the insurer and the insurer stops arguing about hospital rate increases; premiums rise; patient cost-sharing rises. Nothing is saved, and the patient often pays more, because every surviving link takes its percentage of a bigger number.
This is the route Section 4A's coverage matrix exposes, and the one the RFI cannot touch, because the destination is outside its scope by construction. Nothing in 86 pages constrains a hospital rate, a facility-fee differential, a supply-chain markup, or a nonprofit operating surplus.
One version of this route needs stressing, because it hits a proposal we rank second-best in the whole report. A fee-per-member cap (p079) fixes what the insurer earns in administration and profit regardless of medical spending. That is the point of it: it kills the gross-up incentive the RFI identifies at p077. It also gives the insurer no reason left to fight hospital price increases. Under percentage-of-premium economics, higher medical trend means more absolute dollars for the insurer — a perverse incentive, and the RFI is right to go after it. Under fee-per-member economics, provider price increases flow straight to premium and the insurer does not care. ANALYST: fixing insurer incentives correctly removes the only private party with a financial reason to push back on hospital prices. The RFI proposes that half and has nothing for the other half. This is the single sharpest reason the framing problem is not a scoping quibble.
4B.3 Empirical precedents
Precedent 1 — the ACA MLR rule and insurer vertical integration. The canonical case. The ACA imposed a binding constraint on insurer margin as a percentage of premium (80 percent individual and small group, 85 percent large group). The subsequent decade saw rapid insurer acquisition of provider, pharmacy and services assets: Optum became the nation's largest physician employer, and CVS acquired Aetna (p074) SOURCED. The RFI dates the acceleration precisely — "consolidation and vertical integration accelerated in the late 2010s as large for-profit insurers acquired providers, pharmacies, and PBMs" (p074) SOURCED — and attributes causation itself at p077, describing "unintended incentives for insurers to expand into provider, PBM, and pharmacy markets."
Be honest about attribution, because this is the precedent a hostile reviewer will go after. ANALYST: the MLR constraint is one driver among several. Others: cheap money for acquisitions through the 2010s, the move to risk-based and value-based contracting, which pays you to own the delivery assets; Medicare Advantage growth economics, which pay you to own both sides of the transaction; and plain conglomerate strategy. We do not claim MLR caused vertical integration. We claim three narrower things, each of which holds: (i) because the MLR rule is scoped to the insurance entity, it created a specific, measurable reason to move margin outside that entity; (ii) the RFI asserts that causal link itself at p077, so we are borrowing the Committee's attribution rather than inventing one; and (iii) whatever caused the history, the incentive is live today and will operate on any new entity-scoped rule. Point (iii) alone carries the argument, and it does not depend on settling the historical question.
Precedent 2 — site-of-service arbitrage after hospital acquisition of physician practices. Same service, same physician, same building in many cases, higher price — because the billing location changed. Volume 2 quantifies the channel at $95 billion annually, with hospital outpatient departments charging 87 percent more than independent physician offices for identical services, exploiting Medicare's site-of-service payment differential; a $150 office visit becomes a $280 hospital outpatient encounter. SOURCED18. This is relocation in its purest form: the regulatory boundary is what creates the extraction. Two things make it our strongest precedent. First, the money moved in response to a payment-rate difference, not a margin cap — which shows the principle applies to any rule with a scope boundary, not just margin rules. Second, "facility fee" and "site of service" appear zero times in the RFI (Section 4A.3), so the document shows no sign of knowing about the mechanism it would need to anticipate this kind of response.
Precedent 3 — QIA reclassification under MLR. The horizontal route, already realised. The ACA defined a category — quality improvement activity — that counts toward the MLR numerator. The category absorbed "untargeted provider bonuses, general marketing, overhead and lobbying" (p078) SOURCED. A definition created somewhere for the money to go, and the money went there. It is the cleanest demonstration available that every carve-out is a gaming surface — and it is the RFI's own finding.
Precedent 4 — TPA and ASO migration. ANALYST, and we flag it as the weakest of the four because the counterfactual is harder. The self-insured share of employer coverage grew from approximately 6 percent of Americans receiving employer coverage at ERISA's enactment to over 60 percent today (p062) SOURCED. The same four conglomerates — UnitedHealth, Elevance, Cigna, CVS — provide the majority of TPA services, and their ASO profits are nearly five times higher than their profits in fully insured markets (p080) SOURCED. When the unregulated version of nearly the same business earns five times the margin of the regulated version, that is a relocation route, whatever started the migration. Employer tax and cost-control motives clearly drive much of the move to self-insurance on their own; we do not claim MLR drove it. We claim the gap is real, the RFI documents it, and it means the largest part of the commercial market sits outside the instrument the RFI leans on hardest.
Precedent 5 — cross-plan offsetting. A concrete, litigated instance. Kansas sued the TPA of its state employee plan "alleging diversion of state funds to subsidize losses incurred in a different plan" (p082) SOURCED. Margin moved between plans inside one administrator's book. ANALYST: small in dollars, but it proves the movement is real and not a thought experiment.
Exhibit 7 — Relocation register
Read this exhibit next to Exhibit 1's Axis 3 column. Axis 3 says how gameable a proposal is. This register says where the money goes when someone games it. Coverage: all nine proposals rated HIGH gameability in Exhibit 1, plus every MEDIUM-rated proposal with a destination we can name. Route codes: V vertical, H horizontal, X cross-chain.
| # | Proposal | Axis 3 (Ex. 1) | Route | Named destination of the relocated margin | Latency | Verdict |
|---|---|---|---|---|---|---|
| 3.1 | Limit buybacks, executive compensation, non-health-care investment (p072) | HIGH | V, H | Dividends; cash reserves; acquisitions of the very affiliates through which transfer pricing operates; deferred and equity compensation; parent-level execution | One quarter | REROUTING. See 4A.6 |
| 3.16 | Raise or reformulate MLR thresholds (p079) | HIGH | V, H | Affiliate transfer prices; QIA reclassification. The RFI supplies the mechanism itself at p077 | One contracting cycle | REROUTING unless 3.4/3.13 precede it. The sequencing trap of Section 7.5 |
| 3.18 | TPA transparency and plan-sponsor data access (p082) | HIGH | H | Contractual restriction survives the disclosure duty: TPA contracts "include non-disclosure and similar clauses that restrict data sharing and bar the use of independent auditors" (p081) | Immediate | REROUTING absent a non-waivable statutory audit right |
| 3.23 | System-wide transparency and APCDs (p085-086) | HIGH | X | Self-insured ERISA plans, which Gobeille shields from state APCD mandates — absent from all 86 pages (gap G9) | Immediate | PARTIAL. Illuminates the minority of the market |
| 2.2 | Network adequacy floor; ghost-network penalties (p047-048) | HIGH | X | Must-have health systems. The floor raises the price the unexcludable provider can demand; the increase passes to premium as medical trend | One negotiation cycle | REROUTING in concentrated markets. See 4A.7 |
| 2.3 | Prior authorization gold carding (p051) | HIGH | H | Payer controls both the qualifying threshold and the approval rate that determines qualification; volume migrates to non-exempt services and non-exempt providers | One policy cycle | REROUTING |
| 2.4 | PA limits or bans for defined circumstances incl. chronic conditions (p051) | HIGH | H | Undefined-condition boundary. "Chronic conditions" is undefined in the RFI (Section 9.1); UM migrates to adjacent services, step therapy, and post-service review | One policy cycle | REROUTING absent categorical definitions |
| 2.10 | Codify the 2025 voluntary PA pledge (p053-054) | HIGH | H | The self-selected metric. Volume reduction is measured by the regulated party | Immediate | REROUTING |
| 1.8 | Capped rate increases at flat rate or medical trend (p021) | HIGH | H, X | Benefit design: narrower networks, higher deductibles, tighter formularies, market exit. Premium is one of several margin levers | One plan year | REROUTING. Section 7.5 |
| 3.12 | Flat percentage-of-revenue profit cap (p079) | MEDIUM | V | Affiliate revenue. A percentage cap on the insurance entity is the exact case p077 describes | One contracting cycle | REROUTING without consolidated scope |
| 3.15 | Extend MLR to self-insured plans and TPA/ASO (p079, p082) | MEDIUM | V, H | Affiliate transfer pricing again — extends the instrument to the market but carries the instrument's own defects with it; plus fee unbundling into non-MLR service categories | One contracting cycle | PARTIAL. Correct market, defective instrument |
| 3.6 | Limit share of intercompany transfers reportable as medical spend (p076) | MEDIUM | V | Restructuring which entity holds which function; bundling into services with no unaffiliated analogue | One reorganisation | PARTIAL. Blunt cap; 3.4 and 3.13 are the precise versions |
| 3.19 | Require TPAs to pass savings and rebates to plan sponsors (p082-083) | MEDIUM | H | Fee recharacterisation: the pass-through obligation attaches to defined categories, so revenue migrates to undefined ones ("network access," "clinical analytics") | One contracting cycle | REROUTING absent an all-revenue definition |
| 3.21 | Repricer and RCM reform; pass spread-pricing profit to sponsors (p083-084) | MEDIUM | X | Charge the provider rather than the plan sponsor. Section 6.5 identifies this residual; the RFI notes repricers profit from keeping providers out of network (p083) | One contracting cycle | PARTIAL |
| 3.22 | Apply bipartisan PBM reforms to TPAs and affiliates (p084) | MEDIUM | V | Whichever affiliate class the reform's definitions do not name | One reorganisation | PARTIAL, definition-dependent |
| 3.2 | Private equity restrictions and ownership database (p072-073) | MEDIUM | V, H | Management-fee and lease structures. "Roll-up," "sale-leaseback" and "dividend recapitalisation" are absent from the RFI, so the three principal PE extraction vehicles are outside the proposal's own vocabulary | One transaction | REROUTING |
| 3.3 | Vertical integration ownership and financial-relationship reporting (p074-075) | MEDIUM | — | Disclosure only; no margin constraint, therefore nothing to relocate | — | ENABLING. Correctly sequenced (4B.5, principle 4) |
| 3.5 | Break up conglomerates (p075) | MEDIUM | X | Contractual and joint-venture substitutes for ownership; and provider-side pricing power is untouched by insurer divestiture | Years | STRUCTURAL but slow; does not reach Route 3 |
| 2.5 | Neutral third-party evaluators for PA (p051) | MEDIUM | H | Payer-authored medical policy. A neutral evaluator applying the plan's own criteria yields the plan's own result (gap G8) | One policy cycle | PARTIAL unless criteria-setting also moves |
| 2.6 | Reviewer qualification requirements (p052) | MEDIUM | H | A credentialed signatory ratifying machine output at volume. Consistent with Exhibit 2's WEAK rating | Immediate | REROUTING |
| 2.8 | Standardized PA forms, codes and processes (p052) | MEDIUM | H | Determination logic, which is untouched. Reduces payer friction more than provider friction (Exhibit 2: NOT DURABLE) | Immediate | REROUTING |
| 2.11 | Expand denial-data reporting (p055) | MEDIUM | H | Reason-code selection. "Other" is already the modal stated reason (p055) | Immediate | PARTIAL absent mandated categories and timestamps |
| 2.16 | Penalties keyed to denial and overturn rates (p058) | MEDIUM | H | The threshold. Denial rates settle just below the trigger; consistent with Exhibit 2's PARTIALLY DURABLE | One policy cycle | PARTIAL |
| 1.6 | Rate review of administrative cost growth and UM (p020) | MEDIUM | V, X | Affiliate cost, which is genuinely incurred and therefore justifiable; and provider rate increases, which are genuinely incurred and therefore justifiable | One filing cycle | PARTIAL. Strong on Axis 1, exposed on both flanks |
| 1.7 | Federal authority to reject unjustified rates (p020-021) | MEDIUM | H, X | Benefit design and market participation | One plan year | PARTIAL |
| 1.3 / 1.5 / 1.9 / 1.10 / 1.11 | Benefit-design mandates: EHB, pre-deductible high-value care, deductible and coinsurance limits, OOP maximum (p018-p025) | MEDIUM | H | Other cost-sharing levers, utilization management, and network breadth. Constraining one instrument in a multi-instrument set moves the others | One plan year | PARTIAL. Real Axis 2 gains; not Axis 1 instruments |
| 2.20 | Extend consumer protections into self-insured market (p062-063) | MEDIUM | X | ERISA preemption boundary; plan-sponsor cost response | One plan year | PARTIAL |
The proposals with no available relocation route, and why. Exhibit 1 rates 24 proposals STRONGLY POSITIVE on Axis 1 at LOW or MEDIUM gameability. Of those, three have no destination we can name:
- 3.4 — benchmark affiliate payment rates to unaffiliated rates for the same service (p075, p076, p079, p082, p084). Operates on the transfer itself, not on reported margin. The residual channels are real and named in Section 6.5 — services with no unaffiliated analogue, function relocation to the provider side, non-price terms — but there is no destination for the margin that the rule does not follow, provided the comparator is service-level.
- 3.9 — prohibit classifying UM as quality improvement (p078). Closes a reclassification channel by definitional bright line. Nowhere for the reclassified cost to go except out of the numerator.
- 2.7 and 2.15 — presumptive approval of in-network care, and automatic external review without patient initiation (p052, p058). These are default inversions rather than process additions. Relocation requires an action the payer can take unilaterally; a rule under which inaction pays the claim leaves no such action. This is the same property Exhibit 2 identifies as AI-durability, and 4B.5 argues they are one property.
Reconciliation with Exhibit 1: one amendment, one confirmation, nothing contradicted. The amendment is 2.2, network adequacy, where 4A.7 sharpens Axis 2 to IMPROVES nominal / INDETERMINATE effective in concentrated provider markets and leaves the headline rating alone. The confirmation: every Axis 3 HIGH rating in Exhibit 1 has a destination we can name here, and no LOW rating on a STRONGLY POSITIVE proposal does. The two columns were built by different methods and agree, which is a real check on both.
4B.5 The prescriptive counterpart: four design principles
The waterbed principle tells you what fails. These four principles are what survives it. Each one is defined, argued, and then turned back on the RFI to show what it has and what it is missing.
Principle 1 — PERIMETER COMPLETENESS
Regulate the whole company, not the licensed insurance subsidiary. Write a rule against a legal entity instead of a corporate group and the group reorganises around it, because reorganising costs less than complying.
The test for every proposal: where does the rule stop, and what sits just past that line? The second answer is where the money goes. The RFI hands us the textbook failure at p077 — "MLR applies only to the insurance entity rather than the parent company" (SOURCED) — and then scopes nearly every Section 3 proposal to that same entity.
What consolidated-group treatment would require, stated concretely enough to draft:
- Group-level reporting. Care-dollar ratio computed across the consolidated group, with revenue from all affiliates serving the insured population included in the denominator.
- Transfer pricing at documented arm's length, with regulator access. Affiliate transactions priced against the same service sold to unaffiliated buyers, documented contemporaneously, inspectable without a waiver. This is proposal 3.4 elevated from a bullet to the foundation.
- Affiliate transactions treated as related-party transactions subject to disclosure, with a presumption of invalidity where required documentation is not produced — the shifting of the burden Section 6.5 identifies as the highest-value specification addition.
Everyone else already does this. Consolidated supervision is ordinary practice elsewhere. Bank holding companies are supervised at the holding-company level, not just at the insured depository, because the group is the economic unit. Insurance groups already face group-wide supervision and enterprise-risk reporting for solvency. Multinational groups already face transfer-pricing documentation under the tax code — Senate Finance's own jurisdiction, and a mature body of law with an established arm's-length standard. ANALYST: these conglomerates are already supervised as a group when the question is whether they might go bust, and already held to arm's-length pricing when the question is tax. They are supervised one entity at a time only when the question is whether premium dollars reach care. That is the most persuasive framing available for proposal 3.4, and it invents nothing — it applies two things Finance already runs.
Principle 2 — CHAIN COMPLETENESS
Follow a dollar from entry to exit across every intermediary, or the links you cannot see become the hiding place. Lighting up part of the chain is worse than lighting up none: it looks like oversight and it points the money at the dark segments.
Which links does the RFI illuminate, and which stay dark?
| Chain link | RFI illumination | Status |
|---|---|---|
| Fully-insured commercial premium to insurer | MLR reporting, rate review, audit authority (p077-p079) | LIT |
| Insurer to affiliate | Benchmarking and disclosure proposed (p075-p079); RFI concedes regulators "have little visibility into internal pricing flows" (p077) | PROPOSED, not yet lit |
| Self-insured employer to TPA/ASO | Transparency proposed (p082) but contracts "bar the use of independent auditors" (p081) | DARK |
| TPA/repricer to provider | Named at p083-p084; no reporting instrument | DARK |
| PBM economics | Deferred to the June 2026 drug RFI | DARK here, by design |
| Provider-side pricing | Not addressed at all | DARK |
| Group-level intercompany flows | "Financial flows within insurance conglomerates often remain opaque even when ownership is disclosed" (p074) | DARK |
| Patient-borne administrative cost | Asserted, never measured (gap G7) | DARK |
The conclusion the RFI never draws, and it knocks the legs out from under the document's main lever. The RFI states that "The majority of people with insurance are insured through their employers, and the majority of that majority are enrolled in self insured plans" (p062) SOURCED, and quantifies the shift: self-insured employer coverage grew from approximately 6 percent at ERISA's enactment to "over 60 percent" today, "leaving tens of millions of workers subject to these more limited consumer protections" (p062) SOURCED. Verified: the figure is over 60 percent, stated on p062.
MLR does not apply to self-insured plans. So the RFI's main Section 3 instrument — MLR, its modernisation, its thresholds, its audit authority, its definitional repairs — misses most of the commercial market. Here is the arithmetic, computed rather than asserted.
Inputs, each SOURCED.
| Input | Value | Source |
|---|---|---|
| Self-funded share of covered workers | 63% (20% small firms, 79% large firms) | KFF, Employer Health Benefits Survey 2024, Summary of Findings, "Self Funding," p2 |
| Level-funded share, covered workers in small firms offering benefits | 36% | Same, same section |
| Employer-sponsored insurance, nonelderly covered | 154 million | Same, p1, citing KFF Health Insurance Coverage of the Nonelderly |
| Marketplace plan selections, PY2025 | 24.2 million | CMS, Marketplace 2025 Open Enrollment Period Report: National Snapshot, as of 15 January 2025 |
The RFI's own "over 60 percent" self-insured figure (p062) and KFF's 63 percent agree, which is worth saying in the submission: we are not contesting the Committee's number, we are following it through.
Derivation (ESTIMATED — the inputs are sourced, the combination requires one stated assumption).
- Nominally fully-insured share of covered workers = 100% − 63% = 37%.
- Fully-insured employer population = 0.37 × 154M = 57.0M.
- Individual market, entirely MLR-eligible = 24.2M.
- Commercial denominator = 154M + 24.2M = 178.2M. (Consistent with the ~180 million figure used elsewhere in this report.)
- Nominal MLR reach = (57.0 + 24.2) / 178.2 = 45.6%.
- Strict measure, removing level-funded plans. Level-funded arrangements are nominally insured but are self-funded in substance — KFF describes them as combining "a relatively small self-funded component with stop-loss insurance." Solving the KFF firm-size split for the small-firm share of covered workers: 63 = 20s + 79(1−s) → s = 16/59 = 27.1%. Small-firm covered population ≈ 0.271 × 154M = 41.8M; level-funded ≈ 0.36 × 41.8M = 15.0M. Genuinely fully-insured employer population = 57.0 − 15.0 = 42.0M.
- Strict MLR reach = (42.0 + 24.2) / 178.2 = 37.2%.
ESTIMATED: MLR reaches between 37 and 46 percent of commercial covered lives — call it two fifths on the strict measure and just under half on the loosest one. The lower bound is the honest one for policy purposes, because a level-funded plan is exactly the arrangement an employer adopts to get self-funded economics without self-funded scale.
Assumptions and limits, stated so the Committee can check them. (1) The 63 and 36 percent figures are shares of covered workers; the 154 million is people, workers plus dependents. Applying worker shares to a people count assumes dependent ratios do not differ systematically between funding types — KFF does not publish a people-weighted self-funded share, so this assumption cannot currently be removed. (2) Marketplace plan selections exceed effectuated enrollment, typically by around a tenth; off-exchange individual coverage is excluded and would add perhaps one to two million MLR-eligible lives. These pull in opposite directions. (3) Level-funding is published only for small firms; any large-firm level-funding is unmeasured and would push the strict figure below 37 percent. (4) Inputs are 2024 survey and PY2025 enrollment data, not a single-year snapshot. This is an ESTIMATE built from published figures, not a published figure, and the derivation above is the whole of its warrant.
The RFI does propose extending MLR to self-insured plans and TPA/ASO contracts (3.15, p079 and p082), so it has spotted the gap. The ask is "invite feedback," the document's softest register — and what it proposes to extend is an instrument whose defects the RFI has just spent three pages cataloguing. The sequencing is the objection; the verb is only how we located it. ANALYST: fix the instrument first (3.9, 3.13), then extend it (3.15). Extend a gameable metric into a bigger market and you get a bigger gaming surface.
Principle 3 — SIMPLICITY AND CLARITY AS ENFORCEMENT INFRASTRUCTURE
Complexity is not an accident of scale. Somebody built it and somebody profits from it. Every definition is a gaming surface, every carve-out is an exit, and every case-by-case decision is another chance to wear the patient down.
The design consequences, in order of preference:
- Bright-line over standards. "Utilization management may not be classified as quality improvement" is enforceable by inspection. "Quality improvement activities must be reasonably related to improving health outcomes" is a negotiation.
- Categorical over case-by-case. Every individualised determination is a transaction the payer can automate and the patient must contest. Exhibit 1's 0.2 percent appeal rate against a 19 percent denial rate (p055, p057) is the measured consequence.
- Structural over procedural. A procedural requirement adds a step to a process the payer controls. A structural change alters who decides or what the default is.
- Aggregate over transactional. A rule operating on a ratio computed across a book of business cannot be defeated one claim at a time.
Here is the substantive claim of this principle: gaming by software and gaming by accountant are the same problem. Section 8 and Exhibit 2 ask whether automating the payer's response beats a remedy. This section asks whether re-arranging the payer's books beats it. Same question, same answer, because both are just optimisation against a stated target. A rule with a definitional boundary gives the accountant somewhere to move the cost and gives the model somewhere to move the decision. A rule with no boundary — a flipped default, a flat prohibition, a ratio computed across the book — gives neither of them anywhere to go. A simple ungameable rule is an AI-durable rule, because there is nothing for an optimiser to optimise against.
We can check this against our own work, and it checks. Exhibit 2 names five DURABLE remedies: presumptive approval (2.7), automatic external review (2.15), independent adjudication (2.13), approval on timeout (2.9), and consequential liability for overturned denials (2.24). Exhibit 7 above can name no relocation destination for 2.7, 2.15, 3.4 and 3.9. That overlap is not luck: the two lists came from different tests, and the same structural property puts a proposal on both.
Why p052's presumptive-approval framework scores well on both tests. It flips the default instead of adding to the process. It adds no step, no form, no timeline, no credential requirement, no disclosure to a process the payer runs. It changes what happens when nothing happens: silence pays the claim. There is no way to automate against inaction that helps the patient, and no way to book around it either, because the rule bites on the outcome rather than on a cost category. That one property is why the same proposal shows up DURABLE in Exhibit 2, LOW-gameability in Exhibit 1, and with no destination in Exhibit 7.
Principle 4 — TRANSPARENCY AS PRECONDITION, NOT REMEDY
Section 6 shows that transparency is a precondition, not a remedy, and Exhibit 3 shows that every remedy the RFI leans on but one lacks the data needed to enforce it. What this section adds is the ordering: build the measurement FIRST and impose the caps SECOND, because a cap on a flow nobody measures does not constrain the flow. It just tells the industry where to move it.
The logic is mechanical. A cap needs a measured number. Measure that number only at the regulated entity while the flow continues outside it, and the company satisfies the cap by moving the flow while the regulator records compliance. Worse, the cap tells the company exactly which number to manage. Exhibit 3's finding that MLR floors cannot be honestly applied today, because affiliate-versus-non-affiliate payment data does not exist (p077), is that failure happening right now.
Does the RFI order it that way? No. It lists caps and disclosure side by side as equal bullets, and in one place it puts them backwards. Section 3's MLR discussion sets audit authority and line-item disclosure (3.7, 3.8, p077) next to threshold increases and profit caps (3.12, 3.16, p079) with nothing saying which has to come first. The RFI asks for "detailed proposals" on raising MLR thresholds (3.16, p079) — a cap the document's own p077 admission has already made unenforceable. The full sentence is "We invite feedback on this approach, along with detailed proposals for specific adjustments that appropriately limit insurance company profiteering and gaming" (p079): the Committee wants drafting detail on tightening a number it has itself just shown can be moved by transfer pricing. ANALYST: that is the inversion at its clearest, and it is Section 7.5's sequencing trap seen at the level of the document's own drafting order. Three proposals are correctly placed first as infrastructure — 3.3 ownership reporting (p074-075), 3.7 audit authority and 3.8 line-item disclosure (p077) — and all three carry the document's softest verbs: "We welcome feedback on the following topics and concepts" (p074) and "invite feedback on proposals that would strengthen MLR reporting" (p077). The measurement infrastructure is invited; the cap that depends on it is asked for in detail. That ordering is backwards, and it is backwards in the document's own verbs. The point is about sequence, not about resolve: an RFI is entitled to invite on anything it likes, and the useful response is to supply the drafted measurement provisions that would let the cap be enforced when it comes.
4B.6 Synthesis and falsifiable prediction
The prediction, stated so it can be checked. ANALYST throughout.
A reform aimed at insurers, built out of procedural fixes, and scoped to a single legal entity will move extraction, not reduce it. Five years after enactment of any package consisting of coverage restorations, procedural prior-authorization reform, and disclosure without a cap attached, the care-dollar ratio will sit within ±2 percentage points of where it started — while insurer-reported MLR rises and insurer-reported administrative expense ratios fall. Both reported numbers will look better. The real ratio will not move. That gap between the reported and the real is the prediction's signature, and anyone can check it.
Why, one line each. The prediction applies to any package consisting of coverage restorations, procedural prior-authorization reform, and disclosure without a cap attached. Coverage restorations do not touch extraction. Procedural reform is procedural, and Exhibit 2 rates its main pieces NOT DURABLE. Disclosure is infrastructure with no cap attached. Not one of the three closes a relocation route, so a package built from those three components leaves every route in Exhibit 7 open by construction. Meanwhile the $382 billion of unaddressed extraction (Exhibit 6) is still sitting there as a cross-chain destination, and the fee-based-cap incentive effect (4B.2, Route 3) makes the provider-side move easier, not harder.
What would prove us wrong — five things anyone can observe. Any one weakens the prediction; the first three kill it.
- Care-dollar ratio measured at the consolidated group level rises by more than 2 percentage points within five years. This is the direct test and requires the group-level measurement that does not currently exist, which is itself an argument for building it.
- Affiliate benchmarking (3.4) or disallowance of internal markups (3.13) is enacted with a service-level comparator and consolidated scope. If either passes in strong form, the vertical route closes and the prediction should fail. We rate this the most likely falsifier. The test is the enactment itself, observable on its face and requiring no account of how it came about.
- A care-dollar-ratio floor, or a fee-per-member cap, is enacted at the consolidated group level rather than the insurance-entity level. Perimeter completeness satisfied; prediction fails.
- Intercompany eliminations as a share of conglomerate revenue fall materially from the ~one third the RFI reports at p075. Direct observable evidence that the vertical route is narrowing.
- Commercial premium growth falls below general inflation for three consecutive years without a corresponding fall in utilization. Evidence that cross-chain relocation is not occurring.
Which RFI proposals survive the prediction. Four. 3.4 affiliate benchmarking, 3.13 disallowing internal markups, 3.9 barring UM from QIA, and the 2.7/2.15 default-inversion pair. These are the same four that appear in every convergent test in this report: LOW gameability in Exhibit 1, DURABLE in Exhibit 2, destination-free in Exhibit 7, and top-ranked in Section 7.1. Three of the four carry the RFI's softest ask verbs.
Scope of the claim, stated so it is not read narrowly. Section 7.5 identifies one instance of this failure: an MLR threshold increase without the affiliate-transfer prerequisites, which is Route 1 hitting a single item. The waterbed principle is the same failure across the whole package, including the cross-chain route that sits outside the RFI's perimeter entirely and that no item in the document reaches. The single-item version and the package version point the same way; the package version is the stronger claim, because it names the falsifiers and names the four survivors.
So what? One sentence the Committee can act on: do not set a single cap until consolidated-group care-dollar measurement and service-level affiliate benchmarking exist, because every cap that lands first will be met by moving the money and recorded as compliance. That turns the four highest-value items in the RFI from "invite feedback" bullets into the prerequisites for everything else in Section 3 — which is what they are.
4C. How the RFI's own numbers compare with ours
Answer first: the RFI names seven of the extraction channels our model quantifies, puts numbers on three of them itself, and misses six altogether. Wherever both documents measure the same channel, our figure is bigger than theirs. However harsh the RFI reads, it is understating the problem.
4C.1 Where the RFI and our model measure the same channel
| Channel | RFI figure | Our model | Reconciliation |
|---|---|---|---|
| Total administrative cost | "Over $370 billion is spent each year on administrative costs associated with health care in the United States, accounting for nearly ten percent of total spending, and research suggests that over half of that spending is wasteful" (p059-060, sentence spans the page break) SOURCED | Himmelstein and Woolhandler (2020): US healthcare administrative spending $812B, 34.2% of national health expenditure, versus 17.0% in Canada SOURCED37 | The RFI's own anchor is less than half the peer-reviewed figure. The gap is definitional — the RFI's $370B appears to count billing-and-insurance-related transaction costs, Himmelstein counts all administrative and managerial activity. Both are defensible; the RFI's is the narrow one. Our submission should state both and explain the boundary |
| Insurance intermediation | $370B system-wide (p059); ~$1,000 per enrollee in overhead and profit (p071) SOURCED | $578B insurance intermediation: $316B direct + $236B provider-side + $25B/$26B patient-side (Vol 2, 2024 NHEA base) | Consistent in direction, larger in magnitude. Our decomposition supplies the provider-side and patient-side split the RFI lacks |
| Claims adjudication cost | "over 9 billion health care claims are processed each year at an average administrative cost of $12 to $19 per claim" (p060) SOURCED | Premier Inc.: provider-side $57.23 per claim in 2023, up 30 percent in one year; payer-side an additional $40 to $50; combined ~$97 to $107 per claim SOURCED46 | A four-to-eight-fold divergence that must be resolved before either figure is used in a submission. The RFI's $12 to $19 is plausibly payer-side transaction cost only; Premier's $57.23 is the provider's fully-loaded cost per claim including denial rework. The RFI cites the same Premier study elsewhere (p060, fn 253) without reconciling the two |
| Hospital denial rework | "Hospitals report spending over $25 billion in claims adjudication in 2025, and estimate that at least $18 billion was spent on avoidable administrative work to overturn improper claims denials" (p060) SOURCED46 | Same Premier source, matching figures ($25.7B total, ~$18B avoidable) SOURCED46 | Full agreement. This is the single strongest shared number in both documents and should anchor the submission |
| Prior authorization burden | "14 hours completing 45 prior authorizations per week" (p049); "administrative costs of prior authorization account for tens of billions of dollars" (p049) SOURCED | $35B prior-authorization processing line item (Vol 2); 13.2 minutes per authorization; 14.5 hours per week; 30,500 workers in the prior-authorization industry SOURCED18 | Consistent. Our $35B gives the RFI's "tens of billions" a point value |
| Denial and overturn | 19 percent of in-network claims denied, 85 million claims, modal reason "other" (p055); 0.2 percent appealed (p057); "a significant percentage... are overturned on appeal" — no rate given (p057) SOURCED | 80.7 percent of appealed Medicare Advantage prior-authorization denials overturned; 70 percent of provider-side claims denials ultimately overturned and paid (Premier) SOURCED | We hold the number the RFI does not. Scope discipline is essential — see 4.2 |
| Vertical integration self-dealing | UnitedHealth pays its own physician groups 17 percent more than outside ones (p073, fn 319); intercompany eliminations ≈ one third of 2025 revenue (p075) SOURCED | Not separately quantified in Vol 2 | The RFI is ahead of us here. These two figures should be incorporated into our model |
| Medicare Advantage overpayment | Not addressed (RFI scope is private insurance) | $76B in 2026, 14 percent above traditional Medicare — MedPAC decomposes this as ~11 percentage points favourable selection and ~4 points coding intensity, the latter about $22B; CRFB $1.3 trillion over the decade SOURCED42 (MedPAC, March 2026 Report to the Congress, Ch. 12 — the Medicare Advantage status report — cited first-hand, Bibliography 42; CRFB corroborating) | Out of RFI scope but directly relevant: it is the same conglomerates and the same coding machinery. Note our own correction — the prior $83B / 22 percent figures are superseded, and the reason for the reduction (the CMS v28 risk model) is evidence that regulatory intervention measurably reduces extraction |
4C.1a Where the RFI's own cited sources do not support its text
The reconciliation above compares our figures with the RFI's. This subsection is narrower and more serious: it lists places where the RFI's cited source, or the primary series, says something other than what the RFI says. Each was verified by fetching the source and quoting it verbatim; the full evidence trail is retained in our errata working file and available on request. These are offered as corrections to be made before the report is relied upon, not as a challenge to its thrust — which the corrections mostly strengthen.
| # | RFI text (verbatim) | What the source actually says | Materiality |
|---|---|---|---|
| 1 | "Administrative costs have more than tripled since 2020" (p060) | CMS NHEA Table 02, the primary series: net cost of health insurance was $307.1B in 2020 and $306.0B in 2024 — a 0.4 percent decrease. Adding government administration gives $355.2B → $372.1B, +4.8 percent against a claimed >200 percent. Administration also fell as a share of national health spending, 8.4 to 7.0 percent. Neither footnoted source contains a growth series at all LIVE | Highest. This is the RFI's central empirical claim about administrative cost trajectory, and it is contradicted by the government's own accounts. A hostile reader finds this immediately |
| 2 | "over 9 billion health care claims are processed each year" (p060) | Premier Inc., which the RFI cites three sentences later: "Health insurers process about three billion medical claims annually." A 3x gap between two sources on the same page, unreconciled. The 9 billion figure counts all administrative transactions, not adjudicated claims SOURCED | High. Every per-claim total built on this denominator inherits the error — including, until corrected, one of our own |
| 3 | "an average administrative cost of $12 to $19 per claim" (p060) | Premier reports provider-side $57.23 per claim in 2023 plus $40 to $50 payer-side. The RFI's range is 5 to 9 times lower and appears to capture payer-side transaction cost only, presented as the whole SOURCED46 | High. Understates the problem the RFI is trying to establish |
| 4 | "Hospitals report spending over $25 billion in claims adjudication in 2025" (p060) | Premier's survey measures 2023, published 2024. The 2025 attribution is a vintage error SOURCED | Moderate. Corrigible in a footnote |
| 5 | "$370 billion... accounting for nearly ten percent of total spending" (p059-060) | $370B against CMS's $5.28T national health expenditure is 7.0 percent, not "nearly ten percent" LIVE | Moderate. Arithmetic, checkable in seconds |
| 6 | "26.7 million people were uninsured" (p004) | KFF's 26.7 million is the ages 0-64 count; the all-ages figure is ~27.2 million. The RFI presents a non-elderly subtotal as the national total SOURCED | Low on magnitude, non-trivial on precision |
| 7a | "[Cigna] gave its CEO a compensation package worth over $51 million" (p072) | Cigna's proxy statement: David Cordani's FY2025 Summary Compensation Table total is $22,866,134. No figure in the $50-52M range appears anywhere in either Cigna proxy. Compensation Actually Paid is $14.6M; realized pay from vesting and exercises is $18.5M. All three standard bases contradict it, and Becker's and Quiver independently report $22.87M SOURCED50 | Highest, jointly with #1. Proxy statements are public and trivially checkable; this is the single most quotable figure class in the RFI |
| 7b | "CVS... paid its CEO over $23 million in compensation" in 2025 (p072) | CVS's proxy statement: J. David Joyner's FY2025 total is $21,214,084 — under $23M. But $23,431,466 is Karen Lynch's FY2024 total — the former CEO, the prior year. A predecessor's figure appears to have been carried into a sentence about 2025 SOURCED30 | High. Wrong year and wrong executive, or else overstated |
| 7c | "CEOs of these companies collectively received nearly $150 million in total compensation in 2024" (p072) | Not contradicted. The three largest alone total $73.0M for FY2024 (UnitedHealth/Witty $26.3M, Cigna/Cordani $23.3M, CVS/Lynch $23.4M); reaching ~$150M across ten CEOs is consistent. The RFI does not name the ten companies, so the aggregate cannot be reproduced exactly SOURCED | None — recorded as checked and plausible |
The pattern matters more than any single item. Five of the first six understate or misstate in the direction of weakening the RFI's own argument — the administrative-cost trend, the per-claim cost, the share of spending. This is not a document shading figures to inflate its case; it is a document that has not reconciled its sources against each other or against the primary series. That is a fixable sourcing-discipline problem, and saying so plainly is more useful to the Committee than either ignoring it or overstating it as bad faith.
A caution on 7a and 7b that cuts the other way. Unlike errata 1 to 6, these two overstate in the direction that flatters the RFI's argument — which is precisely the pattern a hostile reader hunts for, and executive compensation is the easiest figure in the document to check. We note one unresolved possibility rather than assert a diagnosis: CVS's FY2025 Compensation Actually Paid for Joyner is $50,482,415, the only figure near $50M in any of these filings, so the $51M and $23M claims may have been transposed or drawn from mismatched bases. The RFI footnotes earnings releases rather than proxies at fn 311 to 312, so provenance cannot be fully traced. Either way, neither number should be repeated in a submission without resolution. All compensation figures above were parsed directly from DEF 14A filings retrieved from SEC EDGAR.
One caution on Erratum 1. The "tripled since 2020" sentence footnotes a Georgetown CHIR document whose link returns an empty JavaScript shell, so we could not read it. We therefore state that the claim is unsupported in the sources we could retrieve and contradicted by CMS — not that it was invented. Anyone finalising a submission should obtain that document first.
4C.2 The scope discipline that must not be violated
It is tempting to multiply the RFI's 0.2 percent appeal rate by our 80.7 percent overturn rate and publish the product as a national figure. Do not. It would be wrong, and a hostile reviewer would catch it. The two numbers come from different populations and different units:
- 0.2 percent (p057) is the rate at which patients appeal claim denials in commercial coverage. The RFI sources this to Miranda Yaver's work on denial and appeal behaviour and to Karen Pollitz and colleagues at KFF, whose Marketplace claims-denial analyses are the standard reference for Healthcare.gov appeal rates (p057, fnn 240-243) SOURCED. It is 2021 Marketplace data. The 2024 equivalent from the same KFF series is 0.3 percent — 262,982 appeals against roughly 85 million denied in-network claims, which the publisher characterises as fewer than one percent SOURCED.
- The same Marketplace series reports the outcome of those patient appeals, and it runs opposite to the provider figures below: insurers upheld the original denial in 165,863 of the 262,982 consumer appeals in 2024 — about two thirds lost by the consumer SOURCED. Any sentence that pairs the Marketplace appeal rate with a provider-side overturn rate is contradicted by its own source, and a hostile reader needs nothing but the KFF brief we cite to defeat it. This report does not make that pairing, and no submission drawn from it should.
- 80.7 percent (Volume 2) is the rate at which provider-initiated appeals of Medicare Advantage prior-authorization denials are overturned, from KFF's analysis of CMS Medicare Advantage prior-authorization data for 2024 — where the appeal rate is 11.5 percent, not 0.2 percent SOURCED41. Full citation in the bibliography.
- 70 percent (Premier) is the rate at which provider-side claims denials are ultimately overturned and paid — Premier Inc., "Trend Alert: Private Payers Retain Profits by Refusing or Delaying Legitimate Medical Claims" and its 2024 successor analysis SOURCED — which is the closer analogue to the RFI's universe. Premier is also the source of the $57.23 per-claim provider adjudication cost and the ~3 billion annual adjudicated-claims denominator used in Section 4.
The claim that survives all three universes, and the one that should be quoted: review of a denial is vanishingly rare in every universe measured, and where the appellant is a well-resourced institution — with billing staff, claim histories and the ability to select which denials are worth contesting — it wins most of the time, while the patient appealing alone usually loses. That is evidence about who can afford to argue, not proof that most denials are wrong. ANALYST. It is very nearly as striking as the overstated version and it cannot be defeated by opening our own citations.
The construction that holds up, and the one used throughout this report: appeal rates run from 0.2 percent (patient, claims) to 11.5 percent (provider, prior authorization), against overturn rates of 70 to 81 percent in two independent datasets. Two unrelated sources — KFF on Medicare Advantage prior authorization, Premier on commercial provider-side claims — landing on 70-to-81 percent overturn is the solid finding, and it is stronger precisely because the two use different populations, different payers and different methods. The spread in appeal rates is a second finding: how many appeals get filed depends on who has to pay the cost of filing, not on whether the denial was any good.
4C.3 Channels our model identifies that the RFI misses
Six, carried into the gap register as G5 through G10 and G12: network construction as a profit instrument; float and time-value of retained premium; patient-borne administrative cost; payer-authored medical policy as self-regulation; internal compensation tied to denial rates; and the document's own lack of a consolidated question list. Two further gaps complete the register — G13, the hospital price base, and G14, hospital revenue-cycle and coding AI. G13 is the largest of the fourteen and the one an outside method independently agrees on (4A.4a, 4A.4c); G14 is the half of the AI problem the RFI does not examine at all (8.6a).
Of these, patient-borne administrative cost (G7) is the biggest measurable gap and the one we can fill best. The RFI counts provider burden precisely and patient burden not at all — while building its whole affordability case on 100 million people with medical debt (p011). Nobody has published a figure for the total hours, lost wages and forgone care that patients spend fighting denials. A defensible first estimate would be a real contribution, and it answers directly what the RFI asks for at p007: quantify "the wasteful administrative burden imposed on consumers, hospitals and providers."
4C.4 Where the new evidence cuts against our own thesis
Eight points weaken our own position, or could be read as weakening it. We state them because a submission that raises them first is stronger than one that gets caught out on them, and because two of the eight cut against the mechanism we would most like to establish.
First, taking out the extraction is necessary and not sufficient. Our headline architecture — 42 cents of each healthcare dollar reaching direct patient care, $1.8 trillion extracted from a $5.3 trillion system — is a single-year accounting decomposition, not a forecast. Brailer's argument is that clinical progress is itself inflationary: "Earlier cancer detection expands the population receiving treatment"; "The value is real. So is the inflation. They are not in tension; they are the same phenomenon." Clean out the extraction and real cost growth remains. We should say so out loud.
Second, the cause is how the incentives are built, not corporate villainy. Brailer, who ran the federal health-IT programme, describes the EHR era with no villains in it: the promise was "substantial and sincere," hospitals "learned quickly," and the clinical infrastructure never got built "because the payment system never required it and never rewarded it." Blaming the structure is harder to rebut than blaming motives, requires no claims about what anyone was thinking, and is already implicit in our own best line: "not a market failure but a design feature." The RFI has the mirror-image weakness — it reaches for motive ("Big Insurance," "corporate greed") where structure would be unanswerable.
Third, Brailer is not with us on remedy. He proposes AI transparency, regulatory parity and outcomes-conditioned reimbursement, and he explicitly declines to re-argue structural reform. Cite him for mechanism and diagnosis. Do not conscript him for single payer.
A fourth tension we should raise ourselves. If automation replaces the coders, reviewers and prior-authorization staff, our most vivid statistic — 12 to 15 million administrative workers, roughly $1 trillion in wages — is describing a shrinking asset. Headcount falls and extraction rises. Saying so first puts us ahead of the curve instead of behind it, and it makes the central claim sharper: automation makes extraction cheaper per unit, which is exactly why there is more of it.
A fifth point, imported from the external structured review of 30 July 2026 (Thomas Ferguson, independent of Brainworks — attribution at 4A.4c), and it cuts against the RFI's flagship option rather than against us — but we should be the ones to say it. The RFI puts the single-payer administrative-savings case at p038: "A single payer system would seek to generate significant administrative savings, estimated at over $500 billion annually, by eliminating barriers and bureaucracy imposed by insurance companies on providers and hospitals and leveraging the efficiencies of the Medicare program" (p038) SOURCED. That figure is a gross administrative-savings estimate. It carries no offset for the utilization increase that follows universal first-dollar coverage, no transition cost, and — the point that belongs in this report — no assumption stated about what happens to hospital prices. A single payer that inherits commercial hospital prices at 254 percent of Medicare banks the administrative saving and leaves the price base where it is (Exhibit 5, 4A.4a). A single payer that resets the price base to a Medicare multiple is a much larger intervention than $500 billion of administrative saving, and a much harder one to pass. The RFI does not say which one it means.
Why we raise it against ourselves and not only against the RFI. We do not lean on the $500 billion figure anywhere in this report — checked by grep, it appears only where we quote or cite the RFI's own use of it. But our critique is that the RFI's perimeter is too narrow, and the same objection lands on any remedy that changes who pays without changing what is charged. A submission that raises the hospital price base against the insurer-conduct package and then goes quiet about it when the subject turns to single payer is applying its own test selectively. The honest form: the price base is the question for every remedy in the document, including the ones we are sympathetic to.
A sixth point, and it is about the shape of our own argument. That same review's competing-hypotheses result places insurer conduct as a partial cause — roughly even as a sole cause — with hospital and provider market power co-leading alongside fee-for-service structure (4A.4c, all ANALYST, all theirs). A fair reader could take that as a hit on this report, which is substantially an insurer-extraction critique. It is not, and the precise statement matters. We have never argued that insurer conduct is the primary driver of health-care cost growth. Our claim throughout is narrower and survives their result intact: the RFI's perimeter is too narrow for its own stated standard, it covers 24 to 32 percent of measured extraction, and the largest thing outside the perimeter is hospitals. Their finding is our finding, reached by a different method. So we do not soften a single conclusion in Sections 5 through 11 — every one of them is a statement about what the RFI's proposals do to the channel they target, and those hold regardless of how the drivers rank. What we do is state the relationship rather than let a reader infer a claim we never made: insurer extraction is real, large, and not the whole machine — which is exactly why the perimeter is the argument.
Seventh, our strongest ghost-network evidence is a small study, and we say so before anyone else does. The 82 percent ghost-listing and 18 percent appointment figures cited at M9 and in Section 2.2 come from the Senate Finance Committee Majority staff's own secret-shopper study of May 2023 — which is rhetorically useful, since it is the Committee's own instrument. It is also 120 calls, across 12 Medicare Advantage plans in six urban counties, for mental-health providers only. Three caveats a hostile reader will find, so we state them first: (1) "ghost" is operationally defined as any listing that did not yield an appointment, so the 82 percent is the exact complement of the 18 percent and not an independent measurement; (2) the study counted six calls routed to a third-party matching service as successful appointments, and reports that without them the success rate falls to 13 percent; (3) mental health is the worst-case specialty, and Medicare Advantage is one market segment — this figure should not be generalised to all networks, and we do not generalise it. What it establishes is that roster membership and obtainable appointments diverge enormously in at least one measured segment, which is sufficient for the definitional argument in Section 2.2 and insufficient for a national dollar figure. That is precisely why M9 carries no dollar.
Eighth, and hardest: the Committee's own ghost-network study does not support our profit-motive claim. We read all eight pages. It contains no allegation of financial motive anywhere. Its framing is accuracy failure plus regulatory under-enforcement — "CMS does not currently audit these directories on a regular basis," directories "have not been audited since 2018." The closest it comes is that findings "suggest that plans are not accurately representing who is actually in their network." So when this report describes network construction as a profit instrument, that is our inference and it is labelled ANALYST, not a finding we can attribute to the Committee or to any source we retrieved. The mechanism is coherent — a plan that pays less and contracts thinner retains more, and Milliman's reimbursement data SOURCED supplies the causal middle — but no source we could obtain asserts intent, and we do not claim one does. Stating this costs us the sharper version of the M9 argument. Overstating it would cost more.
So what? We and the RFI are measuring the same machine with different instruments, and ours reads higher on every shared channel. Our credibility depends on reconciling the two divergences honestly — the administrative-cost boundary and the per-claim cost — instead of quietly picking the bigger number.
5. The diagnosis is strong; the remedies do not follow from it
Answer first: we checked every framing statistic in the RFI against the page files and they all hold up. Then we checked what the RFI proposes to do about them, and it is nowhere near big enough. The document diagnoses a structural problem and prescribes paperwork.
5.1 Verification of the framing statistics
All confirmed verbatim against the page files; our verification log §1 holds the full table. The right-hand column records whether the RFI's text matches its own page — not whether the underlying claim survives checking against the primary source. Four of these do not, and Section 4C.1a sets out which: the $370 billion administrative figure and its "nearly ten percent" characterisation (contradicted by CMS National Health Expenditure Accounts Table 02), and two of the three executive-compensation figures (contradicted by the companies' own DEF 14A proxy statements). A statistic can be quoted accurately and still be wrong, and this table only tests the first thing.
| Statistic | Page | Quoted accurately | Primary source |
|---|---|---|---|
| 19 percent of all in-network claims denied in 2024 | p055 | YES | CMS Transparency in Coverage / Marketplace issuer reporting, via KFF SOURCED |
| Amounting to 85 million claims | p055 | YES | Same series SOURCED |
| Most common stated reason: "other" | p055 | YES | Same series SOURCED |
| Appeal rate approximately 0.2 percent | p057 | YES | Yaver; Pollitz et al., KFF SOURCED |
| Fewer than 1 in 20,000 claims reach external review | p057 | YES | Same SOURCED |
| Over $370 billion annual administrative cost, nearly 10 percent of spending, over half wasteful | p059 | YES | Contradicted. CMS NHEA Table 02 gives $372.1B against $5.28T = 7.0 percent, and the trend claim fails outright — see 4C.1a errata 1 and 5 |
| Over $54 billion in profit, seven largest for-profit insurers | p070 | YES | Company financial reports; not independently re-derived |
| CEOs collectively received nearly $150 million in 2024 | p072 | YES | Checked and plausible — top three total $73.0M from DEF 14A filings; the ten companies are not named, so the aggregate cannot be reproduced exactly. See 4C.1a erratum 7c |
| 14 hours per week completing 45 prior authorizations | p049 | YES | American Medical Association prior-authorization physician survey SOURCED |
| Over 100 million with medical debt, more than 4 in 10 of them insured | p011 | YES | KFF/Peterson-KFF Health System Tracker, 2022 vintage SOURCED |
Two things the Committee should know, and we should raise them helpfully rather than as a gotcha. The 100 million medical-debt figure comes from KFF work published in 2022 (p011, fns 32-33), as do the "about half cannot meet their deductible" figure (p022, fn 83) and "more than one in four American households" (p024, fn 88). The FEHB gross-margin comparator at p079 rests on a Commonwealth Fund paper from 2003. A document claiming to succeed the 2008 Call to Action should not build its affordability case on four-year-old and twenty-three-year-old measurements when the underlying surveys have since been run again.
5.2 The proportionality test
Put the diagnosis and the proposed fix side by side, channel by channel.
| Diagnosed condition | Page | Prescribed remedy | Ask strength | Proportionate? |
|---|---|---|---|---|
| Insurers generate revenue by retaining premium dollars through denial and delay | p059 | Report more data; standardise notices; qualify reviewers | IF/RF | NO. None of these changes the economics of a denial |
| 85 million denials, modal reason "other" | p055 | Expand reporting; require plain language | IF/RF | NO. Better labelling of an unchanged volume |
| 0.2 percent appeal rate; barriers "perhaps intentionally so" | p057 | Automatic external review; unified appeals framework | IF | YES in substance, NO in emphasis. The correct remedy is present and carries the weakest ask verb |
| Recovery for a wrongful denial is limited to the claim amount, creating "a corresponding incentive... to deny care" | p065 | Private right of action; fiduciary duties; consequential damages | IF | YES in substance, NO in emphasis. Same pattern |
| MLR applies only to the insurance entity; affiliates absorb the margin | p077 | Audit authority; line-item disclosure; benchmark related-party transactions | IF | YES in substance, NO in emphasis. Three correct remedies, all "invite feedback" |
| Lobbying, marketing and overhead counted as quality improvement | p078 | Strengthen classification rules; independent review; bar UM from QIA | IF | YES in substance, NO in emphasis |
| ASO profits nearly five times fully-insured profits; contracts bar independent auditors | p080-081 | Fiduciary duties; per-member-per-month fee structure; pass-through requirements | RP | YES. Section 3.IV is the best-calibrated part of the document — right diagnosis, structural remedy, and the document's hardest ask verb |
| Plans violate the existing 90-day directory requirement | p056 | New penalties; extend the window | IF | NO. The problem stated is non-compliance; the remedy offered is a longer rule to not comply with |
| DOL is not adequately enforcing ERISA | p058 | Discussed as context | none | NO. No enforcement proposal follows the finding |
| Interagency inquiry begun 2024 has produced no progress | p085 | "Senate Democrats invite feedback on these concepts, and proposals to improve federal oversight" (p085) | IF | NO |
5.3 The pattern
What the RFI proposes falls into three tiers. The ask strength does not track the tier — it tracks the target.
Tier 1 — changes the economics (five proposals: 2.7, 2.13, 2.15, 2.24, 3.13). Flips a default, takes the decision away from the party with the financial interest, or makes a wrongful denial cost money. Four of the five carry "invite" verbs; 2.13 alone gets "We seek feedback on how such a system could be designed" (p056). None gets a request for proposals.
Tier 2 — changes the accounting (roughly ten proposals, clustered at p076 to p082). Shuts a relabelling or transfer-pricing channel. Here the ask splits along a clean line. The MLR-side items (3.7–3.16, p077 and p079) are all introduced with "invite." The TPA-side items (3.17–3.19, p081–082) sit under "Senate Democrats request detailed comments and analysis" (p081) — the document's hardest register. Same tier, same economic logic, opposite ask strength. The difference is that one set points at insurers and the other at their administrative subsidiaries.
Tier 3 — changes the process (most of the document). Adds a form, a disclosure, a deadline or a credential. This tier gets the most pages and the most confident prose, but not the hardest asks either.
The diagnosis is Tier 1. The prescription is Tier 3. And the hardest asks are reserved for the slice of Tier 2 that targets middlemen rather than insurers.
5.4 The one place the RFI gets proportionality exactly right
Section 3.IV on third-party administrators (p080 to p084) diagnoses a mechanism — middlemen "generate profit by managing costs and complexities across claims and billing processes, many of which are likely created by their health plan affiliates" (p080) — and prescribes a structural remedy: convert ASO contracts to a defined per-member-per-month fee, which "forecloses opportunities to generate revenue using tactics such as spread pricing" (p082). The fix bites at the same point as the problem. It also carries a strong ask verb ("request detailed comments and analysis," p081). Hold this section up as the model for the rest of the document.
So what? Nobody has to sell the Committee on the diagnosis — the Committee wrote it. What the Committee asked for on its Tier 1 and Tier 2 proposals is feedback, and the most useful feedback is finished text: evidence and drafted provisions that let those items move from an invitation into a bill. That is the most useful thing our submission can do.
6. Disclosure is the first step, not the reform itself
Answer first: transparency is not one reform among many here. Almost every other reform in the document depends on it, and the RFI half-sees this. The distinction it never draws cleanly is between showing prices to patients, which has been tried and failed, and showing the money flows inside these companies to regulators, which has never been tried at all.
6.1 The RFI concedes the case, twice
On consumer price transparency, at p022:
"Years of discussion about making prices more available to consumers has not meaningfully improved access or affordability for services that might be theoretically shoppable, and it remains nearly impossible for working people and families to shop for essential health care services and negotiate on a level playing field with providers and hospitals... Many services, such as emergency care, are not shoppable at all. Transparency on its own is not a comprehensive solution."
And at p085, on structural transparency:
"Establishing strong transparency and reporting requirements is an important part of comprehensive health care reform, though transparency alone will not address affordability or immediately resolve the profiteering and gaming."
Those are two different statements and the RFI runs them together. The first is a verdict on fifteen years of failure. The second is a caveat about something nobody has built yet. Merging them invites the reader to conclude that transparency is a weak tool in general, when the real conclusion is that we have been making the wrong thing transparent.
6.2 Why consumer price transparency was always decorative
Three reasons, all present in the RFI's own text.
It requires shoppability, which most care lacks: "the majority of health care services are not shoppable, and a significant portion of high-cost surgeries are not elective" (p023). It requires negotiating leverage patients do not have: "Patients do not have leverage to negotiate prices, and most do not have the time, energy or medical knowledge to participate in negotiations over the cost of their complex medical care" (p022). And it places the burden on the party with the least capacity at the moment of least capacity — the RFI's own example is a patient shopping for chemotherapy "while in the midst of cancer treatment" (p022).
The deeper objection: showing prices to patients makes the patient the enforcer. Showing money flows to regulators makes the regulator the enforcer. Only one of the two has subpoena power.
6.3 What transparency would have to specify to actually work
The RFI asks the right question at p076 — "the types of transparency and reporting requirements that would provide researchers and policymakers with the relevant and actionable information needed" — and its own bullets do not answer it. A workable specification needs six elements. The RFI's asks pin down at most two.
| Element | RFI's typical specification | What is required |
|---|---|---|
| Reporting entity | "insurance companies," "plans" | The consolidated parent, plus every affiliate transacting with the insurance entity or the plan sponsor, identified by legal entity and tax identification number |
| Unit of observation | Aggregate annual, per market | The transaction. Per claim, per authorization request, per affiliate payment, per fee |
| Granularity | "line-item disclosures" (p077) — the strongest instance in the document | Service code, site of service, geography, counterparty affiliation flag, transfer price, and the unaffiliated benchmark price for the same service |
| Frequency | Annual | Quarterly for financial flows; monthly with timestamps for denial, authorization and payment data |
| Audit mechanism | "Routine audit authority... along with penalties for non-compliance" (p077) — correct, and the only place it appears | Statutory, non-waivable by contract (necessary because TPA contracts currently "bar the use of independent auditors," p081), with a right of access for plan sponsors and a public audit summary |
| Public availability | "centralized, standardized and publicly available" (p085) | Same, plus a de-identified transaction-level research file, without which the analytic community cannot replicate regulator findings |
| Penalty | "escalating penalties... including increased civil monetary penalties, or the inability to receive federal subsidies or participate in certain markets" (p079) — the strongest penalty language in the document, and it appears once | Same, applied to non-reporting as well as to substantive violation, with a presumption against the plan where required data is not produced |
The single most important addition: if a plan will not produce the data needed to judge a decision, the decision should be presumed invalid. That makes disclosure something the plan wants to do rather than something it has to do, and it is what makes the whole transparency architecture enforce itself. The RFI does not propose it.
6.4 The delay blind spot
Not one transparency proposal in the RFI would measure delay. This is Exhibit 3's only entry marked "NOT PROPOSED ANYWHERE," and it is the biggest hole in everything the document proposes to measure.
The RFI proposes to collect denials, appeals, overturns and reasons (p055, p058). It does not propose to collect timestamps. Without timestamps:
- An authorization approved after the clinical window has closed is recorded as an approval.
- A claim paid after ninety days of serial information requests is recorded as paid.
- The clock-reset tactic the RFI itself describes twice — "manufacturing artificial pauses or resets of the decision clock" (p053) and "making one single claims determination at a time, with each new request for information, denial justification, or medical necessity review restarting the process" (p060) — is invisible in every dataset the RFI proposes to create.
- The float value of retained premium (gap G6) cannot be computed.
A payer playing to the RFI's proposed reporting regime should switch from denying claims to slow-walking them. The reports would show that switch as progress. This is the clearest case in the document of a remedy that would be gamed toward hurting patients more while the statistics got better.
The fix is small and specific: require request, determination, each information request, appeal, and payment timestamps at transaction level, and publish elapsed-time distributions by plan and service category. It should be the first technical recommendation in any submission.
6.5 Intercompany transfers: whether the RFI closes the channel
This is where the money hides, and the RFI knows it. From p077:
"A vertically-integrated for-profit insurance conglomerate is both a buyer through its insurance subsidiary, and a seller through its provider subsidiary, enabling profit shifting through strategic transfer pricing. MLR applies only to the insurance entity rather than the parent company, which has created unintended incentives for insurers to expand into provider, PBM, and pharmacy markets to maximize profits and avoid rebate obligations."
And the scale, from p075: "Intercompany eliminations accounted for approximately one third of UnitedHealth Group's total revenue in 2025."
Move the margin from the regulated insurance entity to an unregulated affiliate and MLR floors, rate review and profit caps all fail at once, all in the same direction. Rate review looks at the insurer's costs, which really are higher, because it is paying its affiliate more. MLR looks at the insurer's medical spending, which really is higher, for the same reason. A profit cap on the insurance entity binds on a number the profit has already left. Every instrument reports success.
Does the RFI close it? Partly, and only in its softest voice. Three proposals touch the channel:
- "Limiting the share of transfers and eliminations that can be reported as medical spending" (p076) — a blunt cap, gameable by restructuring which entity holds which function.
- "Restoring parity with unaffiliated providers by capping intercompany transfers at benchmark rates tied to median prices or a percentage of Medicare rates" (p076) — this one closes the channel.
- "Disallowing internal price markups from MLR calculations, and capping or benchmarking related party transactions to prices paid to unaffiliated entities for the same services" (p079) — this one closes it more precisely, because the comparator is the same service rather than a median.
Proposals 2 and 3 are the right answer. Both appear as bullets under "we request feedback" and "Senate Democrats invite comments." Neither is flagged as the foundation of Section 3, even though every other Section 3 remedy stands on it.
What stays open even so. Add affiliate benchmarking and three sub-channels are still there, none of them addressed anywhere in the RFI:
- Service definition. Benchmarking requires a comparable unaffiliated transaction. A conglomerate can restructure affiliate services into bundles with no unaffiliated analogue — a "care-coordination platform fee," a "network-access fee" — for which no benchmark exists by construction. Time to production: one contracting cycle.
- Function relocation. Move the function out of the payment stream entirely and charge the provider or the plan sponsor rather than the insurer. Repricer and revenue-cycle-management fees (p083-084) already work this way. Benchmarking insurer-to-affiliate payments does not touch affiliate-to-provider extraction.
- Non-price terms. All-or-nothing, anti-tiering and anti-steering provisions (p082) move volume rather than price. A benchmarked rate on redirected volume still increases affiliate revenue.
So what? Every other remedy in this document stands on transparency, and the RFI has specified about a third of what is needed. Three additions do the most work: transaction-level timestamps, a statutory audit right no contract can waive, and a presumption that a decision is invalid when the plan will not produce the data behind it. All three are technical, none of them asks the Committee to take a position, and together they are what makes everything else in the document enforceable.
7. What actually moves money back to care
Answer first: rank the levers by dollars moved per unit of instrument burden and the top three all sit in Section 3 and all carry the RFI's weakest asks. The biggest lever in the document — turning profit and administrative caps from a percentage of spend into a fee per member — appears once, as the first of five bullets, under "invite comments." And the biggest lever of all is missing: nothing in 86 pages makes wrongful denials cost money in proportion to how many of them a plan makes.
7.1 The ranking
Ranked by ESTIMATED dollars redirected per unit of instrument burden. Instrument burden is the authority the remedy requires, on the ascending scale set out in Section 10.1 — enforcement of existing law, appropriations, rulemaking under existing authority, narrow statute, structural statute, coverage architecture, new institution — plus the remedy's legal-durability exposure, which Section 10.2 shows is driven by how much discretion the drafting hands an agency. All dollar figures are ESTIMATED with derivations in 7.2, or ANALYST where a derivation is not possible from public data.
Relocation resistance is the third ranking factor, added after Section 4B. A lever's dollar figure means nothing if the margin it squeezes can be booked somewhere else. RESISTANT means Exhibit 7 can name no destination for the money; PARTIAL means one channel is still open; LEAKY means there is a cheap, fast destination available, so read the dollar estimate as a ceiling that will not be reached without a companion instrument.
That factor moves the ranking in three places. We say so rather than quietly re-sorting. Rank 3 (barring UM from quality-improvement classification) moves above rank 2, because rank 2's fee-per-member cap is PARTIAL: it kills the gross-up incentive but, per Section 4B.2 Route 3, also kills the insurer's reason to fight provider price increases, so part of the value leaks along the chain. Rank 3 is RESISTANT, rulemaking-only, and the keystone. Rank 12 (raising MLR thresholds) drops to last among the substantive levers, below rank 16: it already rated LOW on ratio for gameability, and Exhibit 7 confirms the money goes straight to the affiliate transfer price the RFI describes at p077 — so its $20B-$70B nominal figure is not just discounted, it is close to zero unless ranks 1 and 3 come first. Rank 15 (buyback and executive-compensation limits) stays at LOW, and now we can say why: it governs what happens to profit already taken, and capping payouts without capping capture pays insurers to buy the affiliates that transfer pricing runs through (Section 4A.6).
The ordering of ranks 1, 4, 5, 6, 7, 8 and 11 is unchanged. Rank 1 remains first on all three factors: highest dollars, medium instrument burden, and RESISTANT.
| Rank | Lever | Relocation resistance | Destination if leaky |
|---|---|---|---|
| 1 | Affiliate benchmarking / disallow internal markups | RESISTANT | — (residuals in Section 6.5) |
| 3 → 2 | Bar UM from QIA classification | RESISTANT | — |
| 2 → 3 | Fee-per-member profit and administrative caps | PARTIAL | Provider rate increases pass through to premium (4B.2 Route 3) |
| 4 | Extend MLR to self-insured and TPA/ASO | PARTIAL | Carries MLR's own defects into a larger market; fee unbundling |
| 5 | MLR audit authority and affiliate disclosure | RESISTANT (enabling) | — |
| 6 | TPA/ASO PMPM-only fee structure | PARTIAL | Revenue migrates to undefined service categories |
| 7 | Automatic external review of every denial | RESISTANT | — default inversion |
| 8 | Presumptive approval of in-network care | RESISTANT | — default inversion |
| 11 | Enforcement of existing obligations | RESISTANT | — no new number to manage |
| 15 | Buyback and compensation limits | LEAKY | Dividends; acquisitions; deferred and equity compensation; parent level |
| 12 → last | Raise MLR thresholds | LEAKY | Affiliate transfer prices; QIA reclassification (p077) |
| Rank | Lever | Page | Dollars moved | Instrument burden | Ratio |
|---|---|---|---|---|---|
| 1 | Disallow internal markups and benchmark related-party transactions to unaffiliated prices | p079, p076 | ESTIMATED: recovers up to 14.5 percent of affiliate payment volume; at the largest conglomerate, where eliminations are ~one third of revenue, that is ~4.8 percent of total revenue | MEDIUM — rulemaking under existing MLR authority is arguable; statute is cleaner. Arithmetic in form, so low durability exposure (Section 10.2) | HIGHEST |
| 2 | Convert profit and administrative caps from percentage-of-spend to fee-per-member tied to a growth rate | p079 | ESTIMATED $40B to $90B annually in private markets | MEDIUM-HIGH — requires statute; conceptually simple; removes the gross-up incentive the RFI identifies at p077 | HIGH |
| 3 | Prohibit classifying utilization management as quality-improvement activity | p078 | ESTIMATED low single-digit billions directly, but it is the keystone: it makes the MLR numerator mean what it says | LOW — rulemaking only. 45 CFR Part 158 definitional change | HIGH |
| 4 | Extend MLR obligations to self-insured plans and TPA/ASO contracts | p079, p082 | ESTIMATED $15B to $40B annually | HIGH — ERISA amendment, so structural statute | MEDIUM-HIGH |
| 5 | MLR routine audit authority plus affiliate line-item disclosure | p077 | Not directly dollar-moving; enabling for ranks 1, 2, 4, 6 | LOW — narrow and technical; audit authority is an extension of existing MLR reporting | MEDIUM-HIGH (as multiplier) |
| 6 | TPA and ASO contracts limited to per-member-per-month fees | p082 | ESTIMATED $5B to $12B annually | MEDIUM — ERISA-adjacent statute; the fee definition is arithmetic | MEDIUM-HIGH |
| 7 | Automatic external review of every denial without patient initiation | p058 | ESTIMATED $3B to $34B annually in improperly retained claim value, plus a share of the $18B provider rework | MEDIUM — statute for full scope; achievable for Marketplace plans by rule | MEDIUM-HIGH |
| 8 | Presumptive approval of in-network care | p052 | ESTIMATED: eliminates a large share of the $18B avoidable hospital rework and of the $35B prior-authorization processing cost | MEDIUM-HIGH — statute; over 40 states have already legislated the pattern (p050) | MEDIUM |
| 9 | Independent claims adjudication entity | p056 | ANALYST: largest single structural change available short of coverage-architecture reform | HIGH — statute plus new institution plus appropriations | MEDIUM |
| 10 | Rate review covering administrative cost growth and utilization management | p020 | ANALYST: indirect but broad; forces UM to justify itself economically for the first time | MEDIUM — builds on existing ACA rate-review authority; state capacity is the binding constraint (p020) | MEDIUM |
| 11 | Enforcement of existing obligations (90-day directories p056; ERISA records p058; advance EOBs p064) | — | ANALYST: unquantified, plausibly material | LOWEST — the obligations already exist in law; the remedy is enforcement capacity | See 7.4 |
| 12 | Raise MLR thresholds | p079 | ESTIMATED $20B to $70B nominal | MEDIUM — but see gameability | LOW. HIGH gameability defeats it |
| 13 | Federal authority to reject excessive rates | p020-021 | ANALYST: moderate | HIGH — statute; litigation-exposed | LOW-MEDIUM |
| 14 | Break up conglomerates | p075 | ANALYST: large but slow and uncertain | VERY HIGH — structural statute; multi-year adjudication | LOW |
| 15 | Buyback and executive-compensation limits | p072 | ESTIMATED: $54B profit and "tens of billions" in buybacks are the visible pool (p070, p072), but restricting the use of profit does not increase care spending | MEDIUM — precedent exists (p072, fn 313: EESA 2008 banks; CARES Act 2020 airlines) | LOW on Axis 1, HIGH on salience |
| 16 | Capped rate increases | p021 | INDETERMINATE — could reduce premium or reduce coverage | MEDIUM | LOW. See 7.5 |
| 17 | Independent billing and coding clearinghouse | p061 | ESTIMATED: addresses a meaningful share of the $97 to $107 per claim combined processing cost across the ~3 billion adjudicated medical claims Premier reports annually. Deliberately not scaled by the RFI's 9 billion transaction count — that denominator counts all administrative transactions, not adjudicated claims, and pairing it with a contested-claim unit cost overstates by construction (see Section 4) | HIGH — new institution; the RFI requests specific proposals on ownership (p061) | MEDIUM, with the highest ceiling of any item |
7.2 Derivations
A note on what these derivations rest on. Every input below is either a page-cited RFI figure with its own footnote traced to source, or a figure from our Volume 2 with its bibliography entry. Where an input is our own judgment rather than a measurement, it is labelled and the sensitivity is stated. No derivation in this section multiplies a unit cost by a denominator drawn from a different population — the error identified at Section 4C.1a, erratum 1, and the discipline Exhibit 6 item 17 observes.
ESTIMATED — Rank 1, affiliate benchmarking. Inputs: UnitedHealth is reported to pay its own physician groups 17 percent more than outside ones (p073, fn 319, citing Tara Bannow, STAT News, November 3, 2025) SOURCED; intercompany eliminations were approximately one third of UnitedHealth Group's 2025 revenue (p075, from the company's own SEC filings) SOURCED. Derivation: benchmarking an affiliate payment carrying a 17 percent premium down to the unaffiliated rate recovers 17/117 = 14.5 percent of that payment. Applied to affiliate volume equal to one third of revenue, the recovery is 0.333 × 0.145 = 4.8 percent of total revenue at that conglomerate. Assumptions: the 17 percent differential observed in physician services applies to affiliate transactions generally, which we have not tested and which is likely generous in some service lines and conservative in others; and eliminations are a usable proxy for affiliate payment volume, which is an approximation. We deliberately do not multiply this by a revenue figure, because we hold no verified 2025 UnitedHealth revenue number. Expressing the result as a percentage of revenue is the honest form. Note also that the RFI's $54 billion combined profit figure (p070) is measured after margin relocation, so this recovery is additive to it, not a subset of it.
ESTIMATED — Rank 2, fee-based conversion. Inputs: approximately $1,000 per enrollee per year captured in overhead and profit (p071, citing Larry Levitt, KFF) SOURCED; over 160 million in employer coverage (p026, from KFF Employer Health Benefits Survey) and over 20 million in the individual market (p009, from CMS Marketplace effectuated-enrolment data) SOURCED, so roughly 180 million in private coverage. Derivation: 180M × $1,000 = approximately $180 billion per year in overhead and profit across private markets. If a fee-based cap tied to a growth rate compressed this by 20 to 50 percent over a phase-in — the range reflects that some overhead is genuine claims-processing cost that no cap should eliminate — the redirection is $36 billion to $90 billion annually. Assumptions: the $1,000 figure is undated in the RFI and applies across markets uniformly, which is unlikely; the compression range is a judgment. Cross-check: our own insurance intermediation figure is $578 billion on a broader definition, so $180 billion on the narrow overhead-and-profit definition is internally consistent as a subset.
ESTIMATED — Rank 4, MLR extension to self-insured. Inputs: self-insured plans cover over 60 percent of the insured (p062, p079) SOURCED; ASO profits are nearly five times fully-insured profits (p080) SOURCED. Derivation: if roughly 110 million of the 180 million privately insured are in self-insured arrangements, and the excess margin in that market relative to a regulated equivalent is $150 to $350 per enrollee — bounded below by the observed ASO fee spread and above by the fivefold profit multiple — the recoverable amount is $16 billion to $39 billion annually. Assumptions: the fee spread is a reasonable proxy for excess margin; the fivefold multiple applies to fee income rather than to total plan spend.
ESTIMATED — Rank 6, TPA per-member-per-month conversion. Inputs: ASO fees range from $165 at the 25th percentile to $345 at the 75th percentile per enrollee (p082) SOURCED. Derivation: the interquartile spread is $180 per enrollee for a service whose cost of delivery does not plausibly vary twofold. If one quarter of the roughly 110 million self-insured enrollees sit above the 75th percentile, and conversion to a transparent fee moved them to the 25th percentile, the recovery is 27.5M × $180 = $5.0 billion. If half the population sits above the median and moves halfway to the 25th percentile, the recovery is approximately $12 billion. Range: $5 billion to $12 billion annually. The fivefold ASO profit multiple (p080) is independent corroboration that the spread reflects rent rather than cost.
ESTIMATED — Rank 7, the monetised appeal gap. This is the figure the RFI explicitly asks for at p060: "Senate Democrats welcome analysis and research that provides additional detail on the revenue and profits being generated by for-profit insurance companies when they impose delays and denials that are ultimately overturned."
Inputs, all SOURCED: 85 million in-network denials in 2024 among reporting ACA Marketplace plans (p055); patient appeal rate 0.2 percent (p057, 2021 Marketplace data; the 2024 equivalent is 0.3 percent — 262,982 appeals); overturn rate on appeal 70 to 81 percent (Premier Inc., provider-side claims; and KFF/Vol 2, Medicare Advantage prior authorization — two independent datasets).
The load-bearing weakness in this estimate, stated before the arithmetic rather than after it. The overturn rate is imported from provider-appellant universes into a patient-appellant universe, and in the Marketplace universe itself the patient-appellant overturn rate runs the other way: of the 262,982 consumer appeals filed in 2024, insurers upheld the original denial in 165,863 — about two thirds lost by the consumer. SOURCED. That is why step 5 applies a two-to-four-fold selection discount and why we decline a point estimate. A reader who substitutes the Marketplace's own consumer overturn rate gets a materially smaller number, and the honest position is that no public dataset reports the improper-denial rate among denials nobody contested — which is the reporting requirement this section exists to argue for. The range below should be read as a sensitivity exercise on an unmeasured quantity, not as a measurement. ESTIMATED.
Derivation: 1. Appeals filed: 85,000,000 × 0.002 = 170,000 2. Overturned: 170,000 × 0.70 to 0.81 = 119,000 to 137,700 3. Unappealed denials: 85,000,000 − 170,000 = 84,830,000 4. If the improper rate among unappealed denials equalled the overturn rate among appealed denials, improper unremedied denials would be 59.4 million to 68.7 million. This is an upper bound and we do not use it, because appealed claims are plausibly selected for both merit and value. 5. Applying a selection discount of two-to-four-fold — that is, assuming unappealed denials are improper at 17.5 to 40.5 percent rather than 70 to 81 percent — yields 14.8 million to 34.4 million improper denials that are never remedied, annually, in the Marketplace in-network universe alone. 6. Dollar value cannot be computed from public data, because no average denied-claim value is published for this dataset. That absence is itself the finding, and it belongs in the transparency register. Sensitivity, at three assumed average values:
| Average denied claim | 14.8M improper | 34.4M improper |
|---|---|---|
| $200 | $3.0B | $6.9B |
| $500 | $7.4B | $17.2B |
| $1,000 | $14.8B | $34.4B |
Stated result: $3 billion to $34 billion annually in improperly retained claim value, in the ACA Marketplace in-network universe alone, plus the separately-measured $18 billion in avoidable hospital administrative work to overturn improper denials (p060). We decline to offer a point estimate. An honest range with its assumptions on the table is worth more to the Committee than a fake precise number, and the width of the range is itself the argument for the reporting requirement.
Scope, stated plainly. The 85 million figure comes from the limited universe of ACA Marketplace plans subject to federal reporting — covering roughly 20 million people (p009) out of roughly 180 million privately insured. The employer market, with over 160 million enrollees, has no comparable reporting (p055). We do not scale the estimate to the national population, because the RFI's own evidence at p062 indicates self-insured denial behaviour differs — and differs adversely: "the same insurance company, the same doctor, and the same care" produces different outcomes because oversight differs. The national figure is not just unknown. Under current law it cannot be known — and it is probably worse per head.
7.3 What is missing entirely
Five levers the RFI does not contain, ranked by how much they matter. M0 was added after Section 4B and beats the others on dollars, though not on how easily it could pass.
One point about M2's scope before the ranking. M2 (AI regulatory parity) is the best impact-per-unit-of-difficulty item in the analysis, and its scope covers hospital revenue-cycle and coding AI as well as insurer prior-authorization AI, per Section 8.6a. Same instrument, same difficulty, twice the reach.
M0 — A provider-side price instrument, or any cross-chain constraint whatsoever. Nothing in 86 pages constrains a hospital rate, a facility-fee differential, a site-of-service payment gap, a supply-chain markup, or a nonprofit operating surplus. Section 4A sizes the unaddressed channel at $382 billion a year ESTIMATED. Two things make this the biggest gap and not merely the widest. First, per Section 4B.2 Route 3, this is where insurer margin goes when you squeeze it: moving money along the chain needs an unregulated link, and the RFI leaves the largest one alone. Second, the RFI's best insurer reform — the fee-per-member cap at p079 — takes away the insurer's reason to fight provider price increases, so the package does not just skip hospital pricing power, it strengthens it slightly. The minimum set of companion instruments, all inside Senate Finance jurisdiction: site-neutral payment for services delivered in hospital outpatient departments; enforcement of Internal Revenue Code §501(r) community-benefit standards against the charity care actually delivered; and the p031 Cascade Select structure generalised — a must-offer obligation on the provider, paired with a rate ceiling, in designated concentrated markets. We say plainly that all three carry HIGH-to-VERY HIGH instrument burden — each requires structural statute rather than rulemaking, and the §501(r) route additionally depends on enforcement capacity that does not currently exist — which is why they rank below M1 and M2 on ratio even though they dwarf them on dollars.
The four originally identified levers follow.
M1 — Financial consequence scaled to wrongful-denial volume. The RFI proposes penalties for "repeat offenders that report high rates of denials, reversals, or overturned appeals over time" (p058), which is case-by-case and threshold-based. What is missing is a volumetric liability: a payment obligation proportional to the count of denials overturned on review, payable regardless of whether any individual patient complained. This is the only instrument that makes the expected cost of an automated denial scale with its volume. Under current law, per the RFI's own p065, the expected cost of a wrongful denial is the claim amount times the chance anyone appeals — roughly 0.2 percent of the claim on 2021 Marketplace data, under 1 percent on 2024 data. A denial engine that expects to pay well under a penny on the dollar will deny the claim. Volumetric liability flips that arithmetic. Its absence is the biggest hole in everything the RFI proposes.
M2 — AI regulatory parity, on both sides of the claim. Brailer: "AI performing the functions of a human coder or prior authorization reviewer should be held to the same documentation and clinical criteria requirements as a human performing those functions. This is not a new regulatory category. It is an extension of existing requirements to cover a new actor performing an existing function. CMS can pursue this through rulemaking." The RFI sets credential requirements for human reviewers (p052) and says nothing about the systems doing most of the work. This is the best impact-per-unit-of-difficulty item in the whole analysis, and it is not in the document.
The extension matters as much as the original. Brailer's own sentence says "coder or prior authorization reviewer" — the coder is the provider side — and then his remedies get read as insurer remedies, in his piece and in the RFI. The rule should be written to reach hospital revenue-cycle and coding AI as well as insurer prior-authorization AI: a system performing the function of a human coder, biller or appeals writer inherits that function's documentation, clinical-criteria and record-production obligations. Neither document proposes this. Section 8.6a assesses it — Axis 1 POSITIVE in both directions, Axis 2 IMPROVES, Axis 3 LOW — and it is the only remedy in this report that cuts extraction at both ends of the same transaction. It also closes the arms race the RFI's own footnotes describe (p053, fn 221-222) and never asks about. Same instrument, same difficulty, roughly double the reach: symmetric parity should replace insurer-only parity everywhere this report recommends it.
M3 — Patient-side administrative burden as a regulated cost. The RFI measures provider burden and proposes to reduce it. Patient burden is asserted and never measured, so it cannot be targeted. A requirement that plans report the patient-side steps required to obtain an authorised service — forms, calls, portal actions, elapsed days — would make rationing-by-inconvenience visible for the first time.
M4 — A statutory right to your own claims data that no contract can waive. The RFI notes that TPA contracts "bar the use of independent auditors" (p081) and that consumers have "very limited access to the information plans use to make their coverage decisions, even when requesting it" (p063). It proposes transparency requirements and leaves out the one clause that would stop a contract signing them away.
7.4 The enforcement dividend
Rank 11 gets its own section because it is the only item in the ranking that needs no new authority at all. The RFI records four existing obligations going unmet:
- Plans "are violating the 90-day requirement, particularly in the employer market" for directory accuracy and continuity of coverage (p056).
- "plans do not always fully produce these records upon request," and the Department of Labor "is not adequately enforcing this and other provisions of the ERISA statute" (p058).
- Advance explanations of benefits, mandated in the Consolidated Appropriations Act of 2021, have "not been fully implemented" (p064).
- Of a cross-government coordination and evaluation effort that "appeared to be underway in 2024," "there has not been meaningful progress on those efforts to date" (p085). Quotation corrected to the source wording during the Section 4A/4B verification pass.
The RFI states the enforcement-incentive mechanism directly (p058):
"Failure to adequately enforce existing law means patients are not being protected in times of need, and also creates an incentive for insurance companies to ignore existing federal requirements, knowing there is a relatively low likelihood that they will be held meaningfully accountable."
The RFI also identifies the binding constraint: EBSA "oversees nearly 3 million health plans across the country, and lost an estimated 25 percent of its workforce due to cuts initiated by the Trump Administration in 2025" (p063; the underlying source says over 20 percent — we report 20 to 25 percent). And it identifies the instrument: "permanently increasing mandatory funding for the Health Care Fraud and Abuse Control (HCFAC) Program to conduct oversight and investigations in the private insurance market" (p067).
This is an appropriations question, not a legislative one — the lowest instrument burden of any item in the ranking, because the obligations already exist in law and only the capacity to enforce them is missing. It gets one paragraph on page 67.
7.5 Two levers that look good and are not
Raising MLR thresholds (rank 12) rates STRONGLY POSITIVE on Axis 1 and HIGH on Axis 3, which makes it a bad proposal. Lift the floor from 80 or 85 percent to, say, 90 percent without first closing the affiliate-transfer channel and you have made transfer pricing more valuable, not less. The conglomerate needs a bigger medical-expense numerator; it already owns a machine for producing one; a higher floor pays it more to use that machine. The order decides the outcome: threshold increases have to come after affiliate benchmarking and QIA reform, not before. The RFI asks for threshold increases in one of its strongest voices — "detailed proposals for specific adjustments" (p079) — and asks for the prerequisites in its weakest. Act on the strong ask and skip the weak ones and the reform is dead within one reporting cycle, and the recorded result is a non-effect attributable to sequencing rather than to the instrument.
Capped rate increases (rank 16) are INDETERMINATE on both Axis 1 and Axis 2, and HIGH on Axis 3. A cap on premium growth (p021) constrains revenue without constraining margin. The insurer's available responses are to narrow the network, raise the deductible, tighten utilization management, or leave the market. The RFI itself documents insurers "choosing to exit the ACA market altogether as it becomes less profitable" (p028). Two of the three state public options it reviews — Colorado and Washington — Colorado's plan "has not met its established premium reduction targets" (p030) and Washington "identified initial premium reduction targets that have not been met" (p031) — and Washington's has "experienced challenges establishing broad networks" (p031). Premium is the wrong control variable because it is a price, not a margin. A cap on the care-dollar ratio's complement — the share of premium retained for non-care purposes — achieves the intended effect without the substitution. That is rank 2.
So what? Once you account for where the money can run, the three best levers are affiliate benchmarking, barring utilization management from quality-improvement classification, and fee-based caps — in that order, the middle one having moved up because it holds and needs only a rulemaking, while fee-based caps leak along the chain. The biggest lever inside the insurance perimeter, volumetric liability for wrongful denials, is not in the document at all and should be the headline of our submission. And the biggest lever anywhere is a constraint on hospital pricing (M0), which the RFI cannot contain by construction and which no amount of insurer regulation will substitute for.
8. Automation is how care gets denied at scale, and the RFI barely mentions it
Answer first: automated utilization management mostly does not deny care outright. It stops people getting care by delaying them, wearing them down, and burying them in paperwork — at a volume and speed no human office could manage — and that overwhelms every procedural safeguard the RFI proposes. The denial is the part you can see. Most of the harm happens before the denial and after it. The RFI gives five sentences across four pages to the mechanism that decides whether most of its other proposals work at all.
8.1 What the RFI actually says
The complete body-text inventory, verified newline-tolerant across all 86 pages. Note that this corrects the count we were given: there are five body-text mentions on four pages, not three.
p049 — "Despite the significant dissatisfaction with these practices reported by consumers, for-profit health plans are doubling down on these approaches by subjecting consumers to decisions made by artificial intelligence and chat bots rather than experienced professionals providing meaningful assistance." Footnote 195 sources this to a UnitedHealth Q1 2026 earnings call transcript — that is, to the company's own description of its operations, not to evidence of harm.
p052 — "rather than requiring a doctor to justify their clinical decision-making to an artificial intelligence chat bot, or a human reviewer who has no experience in their practice area, in-network care would be presumptively deemed medically appropriate unless a health plan's clinical review team can demonstrate a patient safety issue or lack of medical necessity."
p053 — "Prior authorization could be particularly prone to automation, and health insurers and providers are increasingly incorporating artificial intelligence into their systems. During listening sessions, some patient and consumer advocates raised concerns about this trend, which may be leading to an increase in improper denials." Note the hedging: "could be," "may be leading to." Footnotes 221 and 222 cite Angus et al., the JAMA Summit Report on Artificial Intelligence, and Mello et al. on the AI arms race in utilization review — two pieces of serious literature supporting three sentences of text and zero proposals.
p054, first — the RFI's only direct question on automation: "we are particularly interested in understanding... whether the changes have addressed specific concerns raised by patients and providers, including concerns related to the use of automated review or artificial intelligence." It is addressed to insurance companies, voluntarily, as part of a request that they explain their own 2025 prior-authorization pledge.
p054, second — the strongest sentence in the document on this subject: "Artificial intelligence is increasingly being used to deny claims and issue justifications, and determinations of eligibility for external appeals are often adjudicated by entities that contract with the health plan itself. Reporting has uncovered examples of large insurance companies denying claims without even reviewing them, and insurance companies have reportedly penalized their claims reviewers when they are not denying claims quickly enough." Footnote 228 sources this to ProPublica: Rucker et al., "How Cigna Saves Millions by Having Its Doctors Reject Claims Without Reading Them," and Rucker and Armstrong, "A Doctor at Cigna Said Her Bosses Pressured Her to Review Patients' Cases Too Quickly. Cigna Threatened to Fire Her" (April 29, 2024).
Beyond these five sentences: "algorithm" appears zero times in 86 pages. "Machine learning" appears once, in footnote 266 on p063, citing DeFrain et al., "Health Insurance Artificial Intelligence/Machine Learning Survey Results," National Association of Insurance Commissioners, 2025 — the insurance regulators' own inventory of insurer AI use, cited in support of a sentence about information asymmetry, with no question asked about its contents.
One more asymmetry worth recording. The RFI's only substantive forward-looking technology proposal is to use "national databases administered by entities such as credit reporting agencies" for eligibility verification (p069). The document's interest in technology is aimed at checking that enrollees deserve coverage, not at the automated systems deciding whether they get care.
8.2 Volume and velocity
The RFI's own numbers describe a process running faster than people can work.
85 million in-network claim denials in 2024 among reporting Marketplace plans, at a 19 percent denial rate, with "other" as the most common stated reason (p055). Think about what that means. A denial reason is the output of a classification step. When the biggest single category is the leftover category, either the categories do not match the decisions being made, or the categories are not what is making the decisions. Either way it points the same direction.
The precise, citable version of Brailer's paraphrase is stronger than the paraphrase. The Senate Permanent Subcommittee on Investigations, "Refusal of Recovery: How Medicare Advantage Insurers Have Denied Patients Access to Post-Acute Care," Majority Staff Report, October 17, 2024, examined 2019-2022 data from UnitedHealthcare, Humana and CVS/Aetna, covering approximately 60 percent of Medicare Advantage enrollment, across more than 280,000 pages of documents including internal materials on algorithms and predictive technologies and on reviewer performance metrics. SOURCED findings:
- UnitedHealthcare's initial denial rate for skilled nursing facility care rose from 1.4 percent (3,016 requests) in 2019 to 12.6 percent (34,359 requests) in 2022 — a ninefold increase.
- In 2022, UnitedHealthcare and CVS denied post-acute prior-authorization requests at roughly three times their overall denial rates; Humana at roughly sixteen times its overall rate, denying 24.6 percent of post-acute requests; CVS/Aetna at 25.9 percent across post-acute services.
- UnitedHealthcare home-health prior-authorization requests rose from 19,283 in 2019 to 356,606 in 2022, an eighteenfold increase — while denial rates for home health fell, because volume was redirected there.
Brailer says the rate "more than doubled." The verified figure for skilled nursing at UnitedHealthcare is ninefold. Our submission should cite PSI directly rather than the paraphrase.
The eighteenfold rise in home-health authorization requests teaches more than any of the others, and it is not a denial statistic at all. It is what a system looks like once it is cheap enough to run everywhere. When each additional authorization costs almost nothing to demand, the profitable number of authorizations to demand is all of them.
8.3 Attrition as the business model
The RFI states the thesis and does not quantify it. From p055:
"The structural barriers faced by patients who wish to challenge claims denials may create additional incentives for plans to deny and delay claims as a revenue driver, particularly in the employer market where transparency requirements and many ACA protections do not apply."
And from p057, on why patients do not appeal: they do not know care was denied or why; "information about rights to appeal is often buried in fine print"; they "do not believe they will be able to take on their insurance company and win"; and the process is "time consuming and unclear, perhaps intentionally so" — sourced to Miranda Yaver, Coverage Denied: How Health Insurers Drive Inequality in the United States (Cambridge University Press, 2026), whose framing of the mechanism as "rationing by inconvenience" the RFI cites three times (p055 fn 232, p057 fn 240, p065 fn 273) without adopting it as an analytic claim.
The arithmetic is in Section 7.2, and the denominators must be kept apart — see 4C.2, which sets out why. Patient appeals of Marketplace claim denials run at 0.2 percent (2021 data; 0.3 percent in 2024), and the patient loses about two thirds of the appeals she brings — insurers upheld the original denial in 165,863 of 262,982 consumer appeals in 2024. Institutional appellants fare the other way round: providers appeal 11.5 percent of Medicare Advantage prior-authorisation denials and win 80.7 percent, and Premier puts provider-side claims denials ultimately overturned and paid at about 70 percent. SOURCED41. Stated with the universes named, the finding is narrower than "most denials are wrong" and harder to answer: review of a denial is vanishingly rare, and a party with billing staff and the ability to select which denials are worth contesting wins most of the ones it picks, while the patient contesting alone usually loses. That is evidence about who can afford to argue. The system does not merely tolerate that gap. The gap is where the money is. We put its annual value in the Marketplace in-network universe alone at $3 billion to $34 billion, and the range is that wide because of one missing data element no RFI proposal would collect.
The RFI gets within a single sentence of saying it at p057 — "The high rate of overturned appeals also suggests that plans may be improperly denying medically necessary care" — and then never states an overturn rate. We have that number, and the Committee asks for it in as many words at p060.
8.4 Delay as a harm distinct from denial
An approval that arrives after the treatment window has closed is a denial. It just never shows up in the denial statistics.
That is this report's central measurement claim, and the RFI's own text contains every piece of it except the conclusion.
It knows delay causes clinical harm: prior authorization is "associated with worsening disease, preventable hospitalizations, longer hospital stays and lower rates of survival" (p050, citing Pickern in AJMC and Murphy et al.); more than one in four physicians report a prior-authorization hurdle leading to an adverse event, and one in five report a resulting hospitalisation (p050, citing the American College of Physicians position paper).
It knows delay is manufactured deliberately, and it says so twice. On prior authorization (p053): "reports of insurers gaming systems to circumvent prior authorization time requirements by manufacturing artificial pauses or resets of the decision clock." On claims (p060): practices "that intentionally delay payment for weeks or months by making one single claims determination at a time, with each new request for information, denial justification, or medical necessity review restarting the process and the timeline for review and payment."
It knows delay has direct financial value to the payer (p059): plans generate "revenue and profit by retaining control over premium dollars that are not being used to pay medical claims, even if only temporarily."
And it proposes no mechanism to measure it. As established in Section 6.4: no RFI transparency proposal captures elapsed time. The reporting expansion at p055 covers denials, reasons and appeals. The appeals reporting at p058 covers denials, reversals and overturns. Neither includes timestamps.
That sets a trap. A plan under the RFI's proposed reporting regime, wanting better numbers, should stop denying claims and start slow-walking them — swapping a recorded denial for an unrecorded string of information requests. Patients get hurt more. The reports look better. This is the clearest case in the document of a remedy whose workaround harms patients while improving the statistics — and one technical requirement fixes it.
8.5 Burden as rationing
Making care hard to get is a way of rationing it. It runs in two directions and the RFI measures one.
Provider-side, measured. Physicians and staff spend 14 hours completing 45 prior authorizations per week (p049, 2025 American Medical Association survey). Our model adds 13.2 minutes per authorization and a 30,500-worker prior-authorization industry. Hospitals spend $18 billion on avoidable administrative work to overturn improper denials (p060). Serial determination is "particularly burdensome for less resourced providers, such as rural hospitals and solo practitioners" (p060) — so paperwork burden weeds out independent providers and favours the big systems. Note that the RFI documents insurers pressuring independent providers "to relinquish independence in order to receive adequate payment rates" (p074). Administrative burden and consolidation pressure are one instrument seen from two sides.
Patient-side, unmeasured. This is gap G7. The RFI asserts that plans "task providers with the administrative burden to navigate their increasingly complex systems" (p063) and that denials impose "stress, barriers to access, and additional costs on patients" (p055). It never measures patient hours, patient calls, patient forms, or patient wages forgone. It therefore cannot target them.
Why this matters more than the provider figure. A provider is an organisation with staff, systems and a financial reason to keep pushing — which is why the appeal rate is 11.5 percent when providers appeal and 0.2 percent when patients have to. Patient burden lands on one person who is, by definition, sick. Wearing people down hits the sickest and poorest hardest, because what it takes to fight a denial — weeks of sustained attention, hold time during business hours, hunting down documents, writing a coherent argument — is exactly what serious illness, low income and low health literacy take away. The 0.2 percent appeal rate does not measure patient satisfaction. It measures how well the attrition works.
8.6 Violation of payers' own rules
This is the sharpest attack available and the RFI does not make it. The claim is narrow and it matters: run adjudication by machine at volume and the decisions stop matching the payer's own published coverage policy and its existing contractual and regulatory duties. If that is right, the answer is enforcement and disclosure under laws already on the books rather than new legislation, which is the lowest instrument burden available (Section 10.1).
What is documented, stated at the correct evidentiary level.
Determinations without individualised review. ProPublica reported that Cigna physicians rejected claims without opening the files, in a process internally known as PXDX, and that a Cigna physician alleged she was pressured to review cases too quickly. The RFI itself cites both stories and characterises them as "examples of large insurance companies denying claims without even reviewing them" and insurers having "penalized their claims reviewers when they are not denying claims quickly enough" (p054, fn 228). Status: investigative reporting, adopted by the Committee in its own text. Not adjudicated.
Automated determinations displacing clinical assessment. In Estate of Gene B. Lokken et al. v. UnitedHealth Group Inc. et al., No. 0:23-cv-03514-JRT-SGE (D. Minn.), plaintiffs allege that UnitedHealth used the nH Predict algorithm to terminate post-acute coverage. On February 13, 2025 the court granted in part and denied in part the motion to dismiss: claims for breach of contract and breach of the implied covenant of good faith and fair dealing survived; other claims were dismissed as preempted by Medicare Advantage law. Broad discovery against UnitedHealthcare was subsequently ordered. Optum disputes the allegations, maintaining that nH Predict is a care-support tool rather than a claims-adjudication tool, and that medical-necessity determinations are made by qualified physicians applying CMS guidance. Status: allegations that survived a motion to dismiss. Not findings of fact. We state this limitation every time the case is referenced, and any external submission must do the same.
Reviewer qualification inconsistent with the payer's own peer-review representations. Only 16 percent of physicians in a peer-to-peer medical-necessity review report having met with a clinician who is appropriately qualified and credentialed (p052, 2025 AMA survey). A peer-to-peer review conducted by a non-peer is not the process the payer's published policy describes. Status: survey evidence, cited by the Committee.
Denial-linked internal incentives. "Some health plans even use incentive-based internal review processes that reward denials" (p052). This sentence carries no citation in the RFI. It is the most legally significant assertion in the document — an incentive structure rewarding denials is difficult to reconcile with an obligation to determine medical necessity in good faith — and it is unsourced. Status: asserted by the Committee without support. Cannot be relied upon as evidence. Should be the subject of a discovery or oversight request.
Documented non-compliance with existing rules. Here the RFI is on its firmest ground and speaks for itself. Plans "are violating the 90-day requirement" on directory accuracy and continuity of coverage, "particularly in the employer market," and they do this "by denying coverage in violation of existing continuity of coverage requirements, or imposing significant paperwork requirements on providers and patients before they will continue providing coverage" (p056). Plans "do not always fully produce these records upon request" under ERISA, and DOL "is not adequately enforcing" it (p058). Status: Committee findings from listening sessions. The strongest available basis for an enforcement-first strategy.
The natural experiment the RFI describes and does not use. From p062:
"Consumers in self-funded plans do not have guaranteed access to external appeals rights, which leaves them subject to an internal review process in which the health plan is evaluating its own decision. This may create a financial incentive for TPAs that administer self-funded plans to deny claims, and leads to disparities in coverage across self insured and fully insured markets, even in cases involving the same insurance company, the same doctor, and the same care. Insurance companies are able to leverage the differences in oversight and regulation in the self insured market to generate revenue."
Same insurer, same doctor, same medical facts — change only the regulator. If the denials change, medical necessity is not what is driving them. That is the cleanest evidence available that denials track regulatory exposure rather than clinical judgment, and the claims data to prove it sits inside every large TPA today. The RFI states it in one paragraph and builds nothing on it. It should be the empirical centrepiece of any serious submission, and it is a study we could scope.
Does the RFI engage the framing? No. It asks the right question once, at p054 — "whether insurance companies are well-positioned to develop reasonable unbiased utilization management policies that do not create undue barriers to patient care" — and cites the governing literature twice: Schwarcz and Monahan, "Preserving Meaningful External Review Despite Insurers' Rulification of Medical Necessity" (p050, fn 208) and Monahan and Schwarcz, "Rules of Medical Necessity," Iowa Law Review 107 (2022) (p059, fn 249). That literature's thesis is that insurers convert medical-necessity standards into rules they write themselves, and so escape any real external review. The RFI has the citation and declines the argument. That is a serious omission, because this is the strongest argument available and it needs no new statute.
8.6a The other half of the machine: hospital revenue-cycle AI
Answer first: this report has treated AI as an insurer denial engine. That is half the picture. The same class of system runs the hospital revenue cycle — coding, site-of-service capture, automated appeal generation — and the two sides are now automating against each other. Every dollar of that fight is administrative. None of it is care. Both sides bill the patient for the war.
The evidence that this is hospital behaviour, not insurer behaviour, is in the figures we have been citing all along. Brailer's two marquee extraction numbers describe what hospitals do:
- $14.6 billion in excess hospital payments attributed to EHR-era coding behaviour, 2019. SOURCED (Health Affairs). Our own standing caution applies and we repeat it rather than bury it: the underlying study (Crespin, Dworsky et al., 2024) covers five states and roughly 15 percent of community hospitals, Brailer's "across payers in 2019 alone" omits that scope, and the disclosed components ($5.8B private, $4.6B Medicare) do not sum to $14.6B. Use it as evidence of a mechanism, not as a national total.
- $2.3 billion in AI-enabled hospital coding excess. SOURCED (BCBSA, March 2026). Caution: a payer trade association quantifying provider behaviour, primary source not obtained. Directionally useful, not citable as settled.
Both numbers count money that hospitals billed, not money that insurers withheld. The revenue cycle is a hospital function, whether run in-house or by a contracted vendor. When Brailer calls this the "extraction economy," the actor performing the extraction is the hospital. The external structured review in 4A.4c makes the same point about the same figures, independently: Brailer's logic is a hospital argument written as a system-wide one.
Three provider-side applications, and what each one does:
- Coding intensity. Automated documentation and code selection push the billed severity of the same encounter upward. It is the same mechanism as the coding-intensity component of the $76 billion total Medicare Advantage overpayment in Exhibit 6 (M16) — about 4 of its 14 percentage points, roughly $22 billion SOURCED42 — run from the provider side of the same transaction.
- Site-of-service capture. Software that routes and bills an encounter to the setting with the higher facility payment. This is Exhibit 6's $95 billion M13a channel SOURCED18, executed automatically rather than by a billing clerk's judgment. The RFI's zero mentions of "facility fee" and "site of service" mean the document has no vocabulary for it.
- Automated appeal generation. Machine-drafted appeals filed at volume against machine-generated denials. The RFI cites the literature on this at p053 — footnotes 221 and 222, Angus et al. and Mello et al. on the arms race in utilization review — and asks nothing about it.
The RFI does know that provider-side automation exists. It says so once and does not follow it. At p053: "Prior authorization could be particularly prone to automation, and health insurers and providers are increasingly incorporating artificial intelligence into their systems." (p053) SOURCED. "And providers" is the whole other half of the problem, and it appears as two words in a subordinate clause. The document then spends every subsequent sentence on insurers. Note also p084, where the RFI describes "Revenue cycle management companies" that "maximize profits when there are administrative hurdles in the health care system that they can be contracted with to navigate" (p084) SOURCED — but the object of that sentence is an insurer-affiliated revenue-cycle vendor, reached through the TPA. The RFI can see revenue-cycle economics when an insurer owns the vendor and not when a hospital runs the function.
The consequence, stated plainly. An arms race between hospital revenue-cycle AI and insurer denial AI raises administrative cost on both sides and moves no dollars to care. Each side's spending is rational and the sum is waste. It also runs in the one direction the RFI's own figures already document: the $18 billion hospitals spend overturning improper denials (p060) SOURCED46 is the provider-side cost of the fight, and the $35 billion prior-authorization processing line in Volume 2 SOURCED18 is a large part of the payer-side cost. Automate both and the volume rises while the unit cost falls, which is why the total goes up rather than down. Neither side pays for this. Premiums and cost-sharing pay for it.
Does this make any Exhibit 2 rating indefensible? No — and it exposes a limit in Exhibit 2's frame that we flag rather than fix by stealth. Exhibit 2 asks one question: does automating the payer's response defeat the remedy? Every rating in it remains correct on that question. But the exhibit models a one-sided adversary, and there are two. Three specific tensions, flagged for the submission and not silently re-rated:
- Presumptive approval of in-network care (2.7, rated DURABLE). Durable against payer automation — the rating holds, and the reason is structural (inaction now favours the patient). But a rule that pays the claim unless the plan affirmatively objects is a rule that automated provider-side coding can exploit at volume. The RFI's own pairing partly answers this: it attaches retrospective audit of "outlier behaviors" and authority to "subject outlier providers to additional prior authorization requirements" (p052) SOURCED. Our recommendation: keep the DURABLE rating and make the outlier-audit pairing a stated condition of it rather than a nice-to-have. Written without it, presumptive approval is durable against one adversary and open to the other.
- Automatic external review of every denial (2.15, rated DURABLE). Holds. Note that at 100 percent review, machine-generated appeals stop being the provider's cost advantage, because appeals no longer need filing. This remedy is one of the few that shrinks both sides' AI spend at once. That is an argument in its favour that the AI-durability test brings into view.
- Independent billing and coding clearinghouse (§11.12, p061). We rate it as having the highest ceiling of any item in Section 7.1. Provider-side coding AI is a reason that ceiling is real and a reason it is hard: a single clearinghouse standardises the coding interface, which removes a large surface for both parties to automate against — and it makes the clearinghouse's own coding rules the thing everyone optimises against instead. Governance is the whole question, exactly as with the adjudication entity.
The missing remedy, and neither document proposes it. Brailer proposes AI transparency and regulatory parity for automated reviewers. The RFI proposes credential requirements for human reviewers (p052) and nothing about automated systems. Neither applies any of it to hospital revenue-cycle and coding AI. The symmetric rule: a system performing the function of a human coder, biller or appeals writer is held to the same documentation, clinical-criteria and record-production requirements as the human it replaced — on both sides of the claim. Assessed on our three axes:
- Axis 1 (care-dollar ratio): POSITIVE, both directions. It cuts payer-side denial cost and provider-side upcoding revenue. It is the only remedy in this report that reduces extraction at both ends of the same transaction.
- Axis 2 (effective access): IMPROVES, indirectly. Fewer machine-generated denials to fight, and a documentation standard the patient's record can be checked against.
- Axis 3 (gameability): LOW. The obligation attaches to the function, not to the technology or the entity, so relabelling the software does not escape it and neither does moving it to a contracted vendor. Compare the credentialed-signatory workaround that makes reviewer-qualification rules WEAK: a per-determination record requirement cannot be satisfied by a signature.
Instrument: CMS rulemaking on the Medicare side, statute for full commercial reach — the same footing as the insurer-only version in Section 7.3's M2. See M2, which covers both sides.
So what? We have been analysing one AI fighting patients. There are two AIs fighting each other, and the patient is the ground they fight on. The rule that binds both is one sentence long and appears in neither document: automate the function, inherit the function's obligations.
8.7 Closing the loop: which remedies change the outcome signal
Brailer's framework applied to policy design. What the denial engine is scored on is whether the claim ends up paying — yes or no, straight away, inside the company. Leave that signal alone and add process on top and you make extraction slightly more expensive, and then the system optimises around you faster than any rulemaking cycle can respond. Change the signal and you change the economics.
Ranked by how completely each alters the signal:
1. Volumetric liability for overturned denials (ABSENT from the RFI). Makes wrongful denials cost money by the count, whether or not any patient complained. Turns the expected value of one more denial from reliably positive into a gamble. Nothing else on this list does that. The optimiser cannot route around it, because the number it is scored on is the number being penalised.
2. Independent claims adjudication (p056, proposal 2.13). "Remove plans from claims adjudication altogether due to their inherent conflict of interest." Removes the signal from the party with the financial interest entirely. Maximal effect, highest institutional cost.
3. Automatic external review without patient initiation (p058, proposal 2.15). Takes the share of denials that get checked from 0.2 percent to 100 percent. Wearing patients down stops paying, so the value of one more denial drops to the odds it was correct in the first place. The best impact-per-unit-of-difficulty remedy in the document, and it is introduced with the words "policy options could include."
4. Presumptive approval of in-network care (p052, proposal 2.7). Inverts the default: the plan must show a safety issue or a lack of medical necessity. Credit where due — this is the most AI-durable idea in the RFI, and the reason is structural, not technological. Automation wins because the payer can act at zero cost while the patient has to spend real time and money. Presumptive approval kills that asymmetry by making doing nothing favour the patient. It does not try to outrun the technology. It makes the technology's speed beside the point. It also keeps genuine utilization management alive — the RFI pairs it with retrospective audit of "outlier behaviors" and the power to "subject outlier providers to additional prior authorization requirements" (p052) — which is what makes it defensible against the over-utilisation objection.
5. Approval on timeout (p053, proposal 2.9). "Deeming any prior authorizations presumptively approved if they are not resolved within reasonable time frames," with "fees or other escalating penalties." This works only if the clock cannot be reset — and the RFI describes clock-resetting in the same paragraph. Write this without making the clock un-resettable and it is beaten inside one contracting cycle. The fix is one sentence: the clock runs from the initial request and no information request pauses or restarts it.
6. Consequential damages for improper denials (p065, proposal 2.24). Currently "financial recovery for improper denials is generally limited to the cost of the claim or benefit that was denied" (p065). Expanding recovery to downstream harm changes the expected cost per denial, though it still requires a patient to act — which is why it ranks below the automatic mechanisms.
7. Mandatory individualised clinical review with an auditable record. Not proposed in this form by the RFI, which proposes reviewer qualifications (p052) rather than an auditable per-determination record. The audit trail is the operative element: a requirement to produce, per determination, the clinical record reviewed, the criteria applied, the reviewer's identity and credentials, and the timestamp. Combined with the presumption of invalidity where the record is not produced (Section 6.3), this is Brailer's regulatory-parity remedy in operational form and is achievable by rulemaking.
8. Penalties keyed to denial and overturn rates (p058, proposal 2.16). Partially durable, and invites threshold gaming: a plan managing to a reported rate will manage to just under the trigger, and will shift marginal cases from denial to delay, which is unmeasured.
Everything else on the RFI's prior-authorization and claims-denial menu leaves the signal untouched. Standardised forms, electronic submission, plain-language notices, gold carding and codified voluntary pledges all change how a decision gets communicated, not what it is worth to make it. Gold carding is the worst of them on gameability: it keys the exemption to a provider's past approval rate, a number the payer itself produces. The payer sets the threshold and supplies the input. Time to production: one policy cycle.
So what? Five remedies in the RFI change what the denial engine is scored on. Roughly fifteen just add process. The document pushes hardest on the fifteen. The most useful thing our submission can do is name the five, explain why they are a different kind of thing entirely, add the missing sixth (volumetric liability), and supply the one sentence that makes approval-on-timeout hold.
9. Chronic illness and long COVID appear nowhere in 86 pages
Answer first: an 86-page coverage-reform document published in 2026 mentions long COVID zero times, ME/CFS zero times, chronic illness zero times, post-viral illness zero times, and chronic conditions in exactly one clause. This is not a constituency the drafters forgot. It is what happens when you build a framework around one-off acute care — and these are precisely the patients for whom all three axes fail at once and worst.
9.1 The verified counts
Newline-tolerant, case-insensitive, all 86 pages. Recorded at our verification log §2.
| Term | Occurrences |
|---|---|
| long COVID | 0 |
| ME/CFS, myalgic encephalomyelitis, CFS | 0 |
| chronic illness | 0 |
| post-viral, postviral | 0 |
| chronic (any form) | 1 |
| disability, disabilities, disabled | 1 |
The sole chronic hit, in full context (p051), under prior authorization, "Limitations or bans":
"Limitations or bans on prior authorization could apply in specific circumstances such as for chronic conditions, time-sensitive treatments where a delay would likely worsen a patient's prognosis (such as treatment for cancer), certain preventive screenings, or specific classes of drugs or treatments, similar to actions taken in Oregon and other states."
One clause, inside an illustrative list, inside one of seven bulleted options, inside a menu the RFI introduces with "request comments and analysis on the following approaches and concepts." No definition of a chronic condition. No mechanism for identifying one. No proposal.
The sole disability hit, in full context (p004):
"In 1965, President Johnson signed Medicare and Medicaid into law, providing high-quality coverage for seniors and people with disabilities."
Purely retrospective, in the document's Democratic-lineage narrative. In 2026, a coverage-reform RFI mentions disability once, in the past tense, about 1965.
For completeness on the related count: "complex" appears roughly 39 times, and we sampled them. The overwhelming majority describe system or process complexity — "complex enrollment circumstances" (p014), "complex administrative delays" (p060), "increasingly complex corporate entities" (p085). Only two describe patient clinical complexity: "the cost of their complex medical care" (p022) and "complex rehabilitation technology" as a benefit category (p053). Two out of thirty-nine. When this document says "complex" it almost always means the system is complicated, and almost never means the patient is.
9.2 An honest disclosure
Our own Volume 2 has the same void. Verified: zero occurrences of "long COVID"; five incidental occurrences of "chronic"; one of "disabil"; and no chronic-illness or disabling-illness cohort anywhere in a twenty-chapter report. Chapter 16, "The Human Cost," covers medical bankruptcy, rural closures, insulin rationing, care prevention, mental health, the uninsured, and worker despair. It does not cover people with continuous multi-specialty need.
We say this because we cannot credibly attack the Committee for a gap we have ourselves. What we claim is that we have found the gap and the mechanism behind it, not that we have already filled it. One further limitation, stated plainly: we looked for published denial or prior-authorization rates specific to long COVID, ME/CFS or other contested diagnoses. No such dataset appears to exist in published form. So Section 9.3 argues the mechanism without numbers rather than estimating around the hole. The hole itself is a research recommendation.
9.2a Long COVID in children: what the evidence actually supports, and why the policy argument does not rest on the headcount
Why this belongs in a document about health financing rather than in a clinical annex. A Committee drafting the architecture for the next health bill needs to know how the system it is designing will treat contested, fluctuating, hard-to-diagnose chronic illness. Long COVID is the cleanest available test case, and it receives zero mentions in 86 pages. What follows is the strongest version of that argument we can defend, which is not the strongest version available in the popular literature.
The scale claim usually made for pediatric long COVID does not survive the controlled evidence. It is commonly said to rival or exceed asthma as the most common chronic condition of American childhood. On systematic review of the non-RECOVER literature, that framing is not supportable, and we do not advance it. The paragraphs below give the numbers, and then the reason the policy argument does not rest on the headcount.
The US national figure, from the government's own survey. The National Center for Health Statistics reports, from the 2022 National Health Interview Survey, that 1.3 percent of US children aged 0-17 ever had long COVID and 0.5 percent currently had it, rising to 2.0 percent ever among children aged 12-17, on parent report and conditioned on a positive test or physician diagnosis SOURCED21. The 2023 survey round gives 1.0 percent of children aged 6-11 and 2.3 percent aged 12-17 SOURCED. Against a population of roughly 72.8 million under-18s this implies on the order of 950,000 children ever affected and 365,000 currently affected ESTIMATED — material, and roughly a fifth of asthma's ~5 million, not a rival to it.
Controlled cohorts put the attributable excess lower still. A Danish nationwide study (Borch et al., European Journal of Pediatrics, 2022) compared 37,522 infected children against 78,037 controls and found an excess of 0.8 percent reporting symptoms beyond four weeks, concluding that "long COVID in children is rare and mainly of short duration" SOURCED21. A controlled meta-analysis (Behnood et al., Journal of Infection, 2022; 22 studies, 23,141 children) found that the frequency of the majority of persistent symptoms was similar in infected and uninfected children, with robust excesses only for loss of smell (8 percent), headache (5 percent), cognitive difficulty (3 percent), sore throat and sore eyes (2 percent each) SOURCED23.
Why the uncontrolled figures are so much higher, and why they are not usable. A pooled meta-analysis of 40 studies covering 12,424 children reports prevalence of 23.36 percent (95 percent CI 15.27-32.53) among infected children SOURCED57 — an order of magnitude above the controlled estimates. The reconciliation is not subtle. The UK CLoCk study, a national matched cohort of 12,632 adolescents with test-negative controls, found that 20 to 25 percent of every infection-status group — including children who were never infected — reported three or more symptoms at 24 months SOURCED49. Background symptom burden in adolescents is high, and any study without a control group measures that burden rather than long COVID. Behnood's authors make the same point explicitly, calling their finding a demonstration of "the critical importance of a control group." The high pooled figures are dominated by uncontrolled studies and should not be quoted as prevalence.
| Method | Typical prevalence reported | What it actually measures |
|---|---|---|
| National household survey, all children | 0.5-2.3 percent | Parent-reported, diagnosis-conditioned, whole population |
| Nationwide matched cohort, attributable excess | ~0.8 percent | Infection-attributable increment over controls |
| Controlled meta-analysis, per symptom | 2-8 percent | Excess of specific symptoms over controls |
| Prospective cohort with research symptom index | 4-15 percent | Symptom clustering among enrolled infected children |
| Uncontrolled pooled prevalence | 15-25 percent | Symptom burden in infected children, uncorrected for background rate |
On the claim that RECOVER under-reports. RECOVER has been criticised for producing conservative estimates. We looked for that critique in the peer-reviewed methodological literature and largely did not find it; the published methodology runs the other way, warning that uncontrolled pediatric studies overstate prevalence by ignoring high background symptom rates. RECOVER's symptom-index approach is a correction for over-counting, not a mechanism for under-counting. One under-count direction is legitimate: the diagnosis code U09.9 is known to be under-applied by clinicians, so EHR-based strands — including the reinfection cohort below — understate true incidence. That is a real limitation of registry ascertainment generally, not evidence for a higher national prevalence. Where "RECOVER under-reports" is asserted as a general proposition, we found it in patient-advocacy commentary rather than in controlled evidence, and we mark it ANALYST and do not rely on it.
What survives, and it is enough. A defensible statement to the Committee is this: long COVID affects on the order of one to two percent of American children on national survey measurement, with an infection-attributable excess of roughly one percent and a wide methodological range above that — a population of hundreds of thousands to roughly a million children. That is not a rounding error and it is not asthma. The financing argument in this section never depended on the larger number, and we make the smaller one carry it explicitly rather than leaving the reader to wonder whether the case collapses with the headcount.
Burden in adults, measured in the standard currency. Al-Aly and colleagues' three-year VA cohort (Nature Medicine, 2024) followed 135,161 infected people against 5,206,835 controls and found that post-acute sequelae still contributed 9.6 disability-adjusted life years per 1,000 persons in the third year among the non-hospitalised, and 90.0 DALYs per 1,000 among the hospitalised SOURCED26. Those are large numbers in a currency built for cross-condition comparison, and they are third-year figures — the residual after most recovery has already happened.
On the comparison to cancer, and why we state it carefully. It is frequently reported that long COVID produces disability exceeding that of many cancers. We could not retrieve a source making that comparison in a form we are willing to cite — and we looked again after this section was first drafted, including at the oncology literature discussed below. We will not manufacture one for a Senate submission when our own Section 4C criticises exactly that practice. What the retrieved evidence does support: the DALY burden above is substantial by any standard, and the condition is chronic, working-age, and in most cases unresolved at three years. The honest formulation is that long COVID imposes a disability burden comparable in magnitude to serious chronic disease, sustained over years, in a working-age population ANALYST — and that the specific cancer comparison should be sourced before use or dropped.
The severity data is where the argument actually lives. CDC investigators analysing NHIS 2022-2023 data across a nationally representative sample of 11,057 children aged 5-17 found that among the 4,587 with prior COVID-19, those who had long COVID reported functional limitations such as difficulty with memory at 18.3 percent against 8.6 percent — more than double — and had roughly 2.3 to 2.4 times the adjusted odds of illness-related chronic absenteeism, defined as missing more than 18 school days for health reasons, with the effect surviving adjustment for both chronic health conditions and neurodevelopmental conditions SOURCED21. This is the number that matters for a financing document. A smaller affected population with severe, measurable, durable functional impairment is a harder problem for an authorisation-driven insurance architecture than a large population with mild symptoms — not an easier one. It is also the point at which the earlier open item on absenteeism closes: it is now SOURCED, and it is sourced to the CDC.
Reinfection compounds the risk, and this is the finding with the most direct financing consequence. The largest study on the point is a RECOVER retrospective cohort across 40 US children's hospitals, published in The Lancet Infectious Diseases in February 2026: 465,717 children and adolescents, of whom 407,300 had a first infection episode and 58,417 a second, over January 2022 to October 2023. A second infection roughly doubled the rate of a clinician-documented long COVID diagnosis — 903.7 per million per six months after a first infection against 1,883.7 after a second, a relative risk of 2.08 (95% CI 1.68-2.59) SOURCED21. Twenty-one further symptom and condition categories were elevated, at relative risks of 1.15 to 3.60 SOURCED.
A second cohort contradicts the reinfection finding, and we report that rather than choosing our preferred study. The CLoCk consortium followed 345 adolescents after a first Omicron infection and 360 after reinfection and found symptom profiles, severity and impact similar between the two groups at 12 months — 17.4 percent of first-positives against 21.9 percent of reinfected children met the research Long Covid definition, a difference that did not reach significance (p = 0.13) SOURCED21. The authors conclude clinicians "may not therefore need to consider number of infections." The two studies are not directly comparable — one measures clinician-coded diagnoses across 465,717 children in a US registry, the other questionnaire-defined status in 705 English adolescents — and registry coding may capture severity that a symptom questionnaire does not. But we are not entitled to present reinfection amplification as established. The honest statement is that the largest registry study finds a doubling and the best-matched prospective cohort finds no difference ANALYST, and that the policy design below should be robust to either being right.
That result settles the cardiovascular question inside a single citation. The elevated categories include myocarditis, heart disease, arrhythmias, chest pain, thrombophlebitis and thromboembolism, alongside acute kidney injury, POTS or dysautonomia, cognitive impairment, fatigue and malaise, and generalised pain SOURCED. The cardiovascular association is therefore not an inference we are asking the Committee to accept on our authority — it is a measured outcome in a half-million-child cohort. The financing consequence does not depend on resolving the reinfection dispute: a condition that recurs on re-exposure at all cannot be underwritten, authorised or budgeted as a single acute episode, which is exactly how the prior-authorisation architecture in Section 9.3 treats it.
In the youngest children the condition is measurable but the instruments are new. A companion JAMA Pediatrics study (Gross et al., 2025) enrolled 472 infants and toddlers and 539 preschool-aged children across more than 30 US sites and derived age-specific research indices, classifying 14 percent of infected infants/toddlers and 15 percent of infected preschoolers as having probable long COVID SOURCED21. Symptom patterns differed markedly between age groups and from those in older children, which is the authors' central point: long COVID is not one phenotype, and an authorisation system keyed to a single symptom list will fail most of the people who have it.
The downstream effects, with the sourcing status of each stated plainly. The cardiovascular association is now SOURCED on the RECOVER-EHR cohort above. The educational dimension is addressed directly by a 2026 Academic Pediatrics study, "School Difficulties and Long COVID in Children and Adolescents" SOURCED21. Workplace absenteeism specifically remains unquantified here. Growth in the disabled population is quantified below, because the federal series is unambiguous and the Committee should see it.
9.2a.1 The disability discontinuity in the federal labour data
The single hardest number in this section is not a clinical estimate at all. The Bureau of Labor Statistics has published the count of persons with a disability aged 16 and over, monthly and not-seasonally-adjusted, since June 2008 (series LNU00074597). We retrieved the full series directly from the federal source rather than reading it off a chart. It shows a level shift that begins in the pandemic year and has not reverted in the six years since SOURCED53.
| Period | Persons with a disability, 16+ (thousands) | Share of civilian noninstitutional population |
|---|---|---|
| 2016-2019 mean | 30,212 | 11.78 percent |
| February 2020 | 30,972 | 11.93 percent |
| 2021 mean | 31,084 | 11.89 percent |
| 2023 mean | 33,501 | 12.55 percent |
| 2025 mean | 35,286 | 12.89 percent |
| June 2026 (latest) | 36,905 | 13.41 percent |
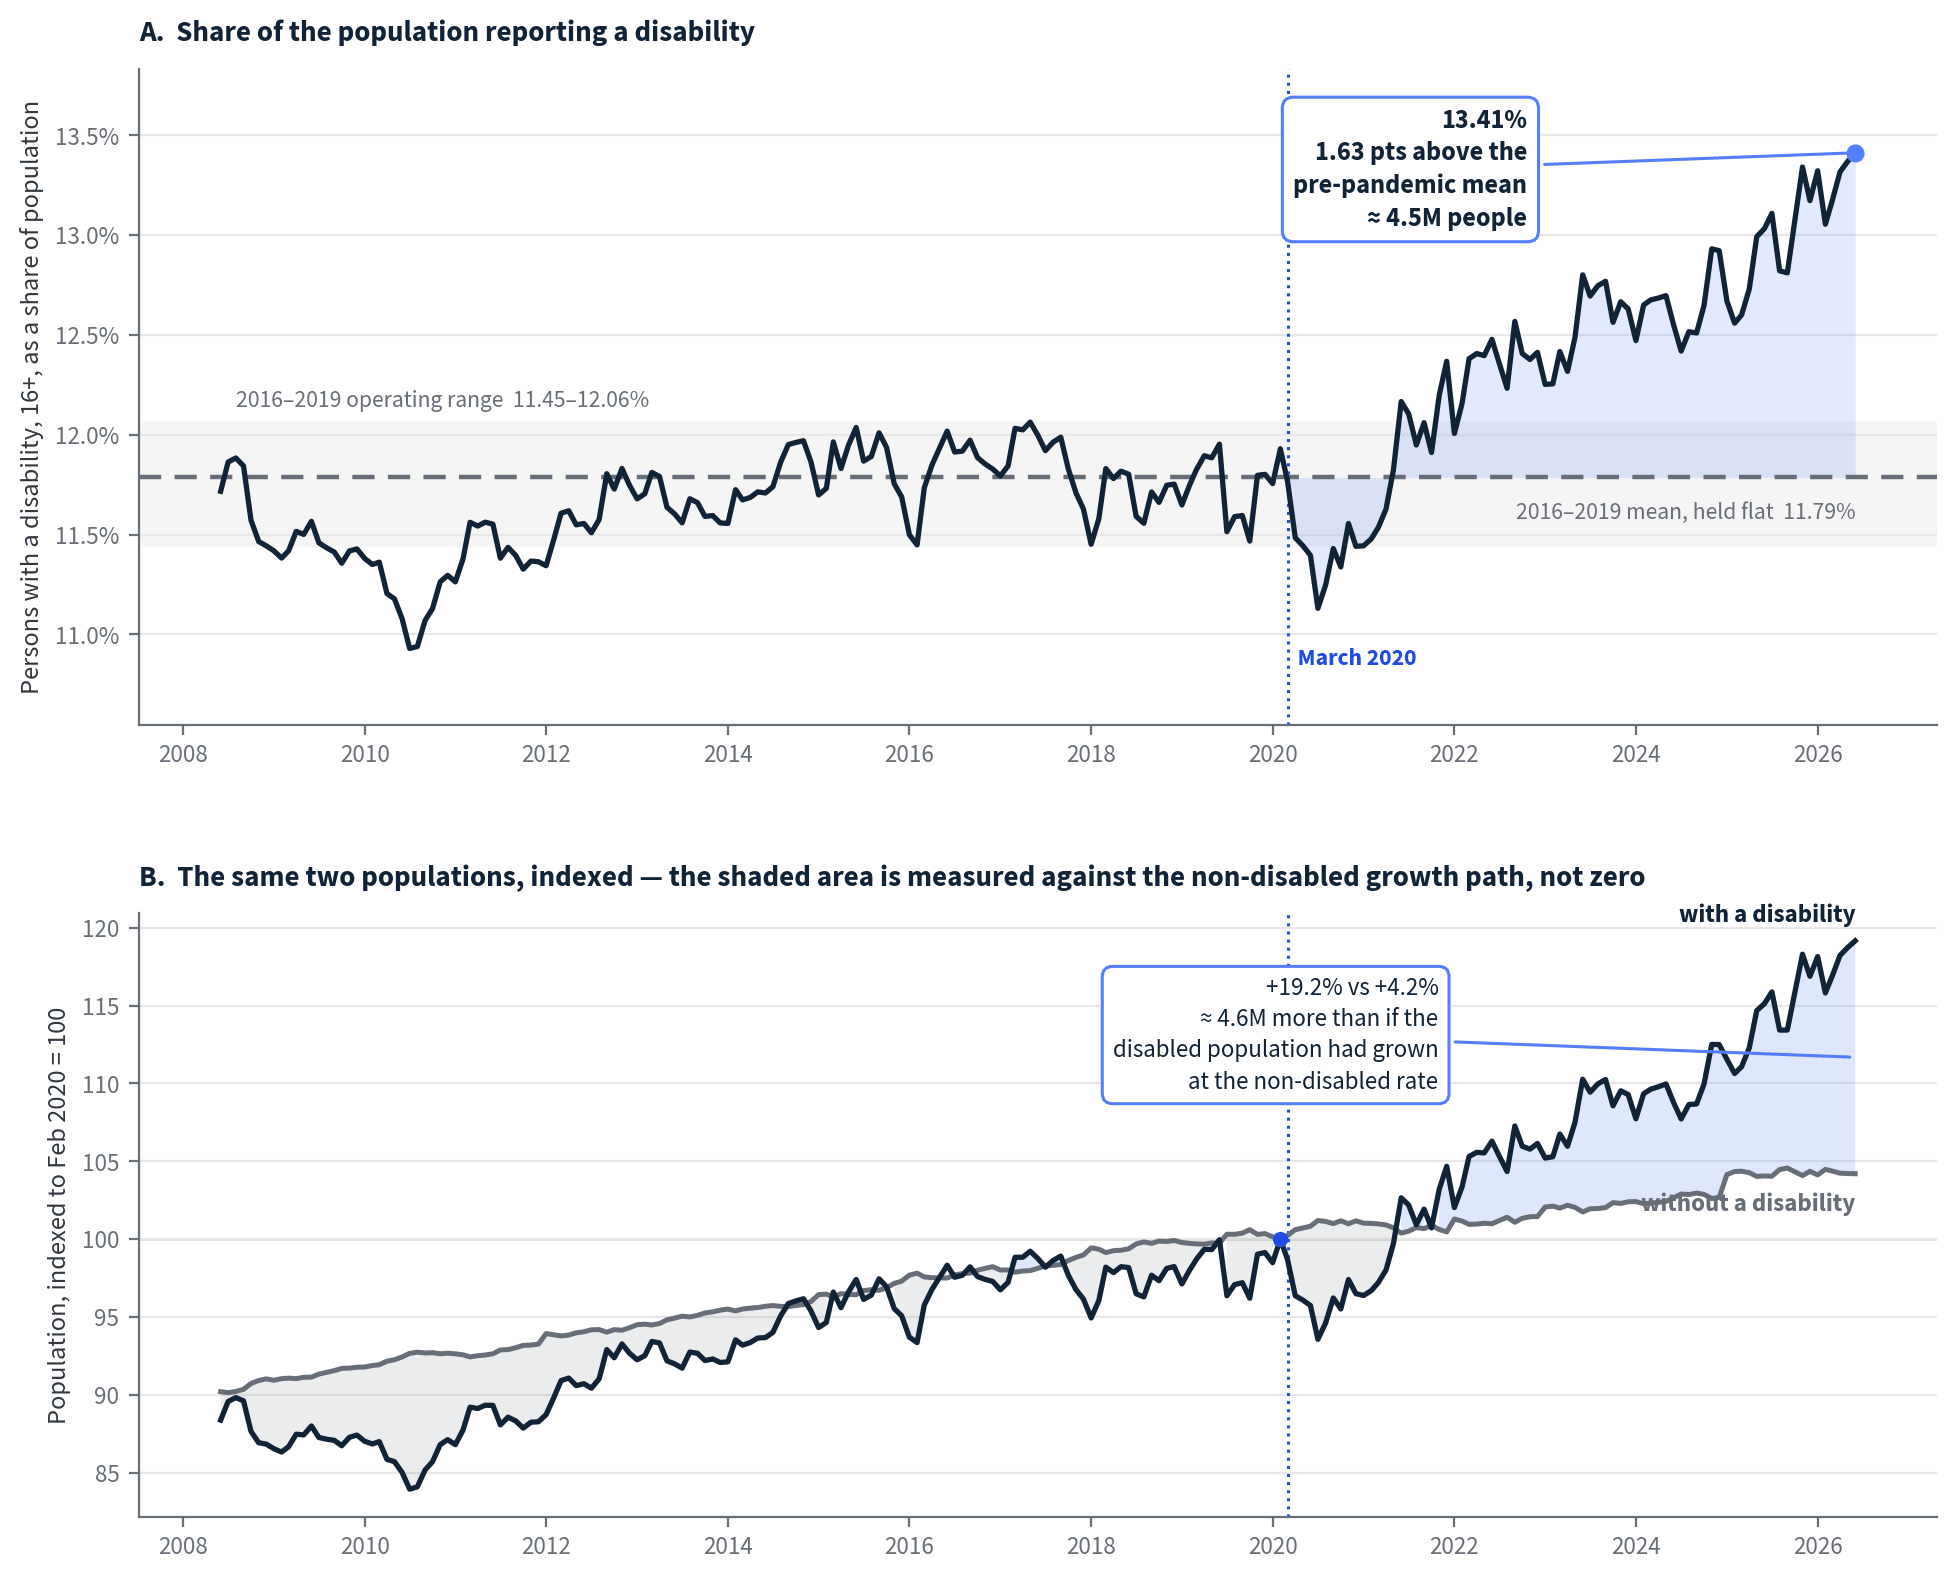
The level rise is +5.93 million people, or +19.2 percent, against February 2020 SOURCED53. We do not rest the argument on that figure, because the population grew over the same period and a raw count would reproduce exactly the denominator error this report attacks the RFI for at 4C.1a. The share is the defensible measure, and it survives the test: disability prevalence moved from a 2016-2019 mean of 11.79 percent to 13.41 percent, a rise of 1.63 percentage points, or roughly 4.5 million people above the pre-pandemic norm, in a series whose entire 2016-2019 range was 11.45 to 12.06 percent SOURCED53. Of the 59 months since July 2021, 55 sit above the highest month of the entire pre-pandemic period. The new level is not at the edge of the old range; it is off it.
A steeper figure was available and we declined it, which the exhibit records. Fitting a linear trend to the pre-pandemic segment and extending it to June 2026 gives a counterfactual of 11.49 percent, and an excess of 1.92 points or about 5.3 million people. We do not use it, and Exhibit 8 does not draw it. The fitted pre-pandemic trend in share terms is slightly negative, so projecting it forward six years assumes disability prevalence would have kept falling, and quietly manufactures part of the gap we are claiming. The flat pre-pandemic mean is the conservative comparator and it is the one we publish — the smaller of the two numbers, chosen deliberately.
In level terms the acceleration is nonetheless real. The count rose about 10,000 persons per month through 2016-2019 and about 88,000 per month from 2021 onward, close to nine times the prior rate ESTIMATED. Six years on, the line has not turned back toward the band. It is still climbing.
A second baseline, and a better one, is the population that did not become disabled. Panel B of Exhibit 8 indexes both groups to February 2020. Through the 2010s the two populations grow in near-lockstep. From 2021 they separate: by June 2026 the disabled population is up 19.2 percent while the non-disabled population is up 4.2 percent SOURCED54 — a factor of roughly 4.6. Had the disabled population merely grown at the rate of everyone else, it would number about 32.3 million rather than 36.9 million, an excess of approximately 4.6 million people ESTIMATED. This matters because it is a different method that lands in the same place: the flat-mean calculation gives ~4.5 million and the non-disabled-growth baseline gives ~4.6 million, and neither borrows anything from the other. Two independent baselines converging within three percent is the strongest form this finding takes.
One caveat belongs in the text and not merely in the caption: the divergence began before the pandemic. The gap between the two indexed series was already widening at about 0.09 index points per month from 2016, and widens at about 0.21 after 2021 ESTIMATED. The pandemic is an acceleration of roughly 2.3 times, not the origin of the trend. Population ageing plausibly explains much of the pre-existing drift. We state this because a reader who discovers it independently would be entitled to discount everything else in the section, and because the argument does not need the stronger claim — a 2.3-fold acceleration sustained for six years, on the federal government's own series, is sufficient.
Three caveats, because the number is strong enough not to need overstating. First, this series counts self-reported disability of any cause; it is not a long COVID measure and we do not present it as one. Causal attribution to any single condition is not available in the data ANALYST. Second, the January observations carry annual population-control revisions; we checked, and those revisions are small and mostly negative (-0.8 million to +0.4 million), so they do not manufacture the rise. Third, pandemic-era changes in survey collection and in disability-benefit application patterns plausibly contribute.
What it establishes, stated at exactly the strength the evidence supports. The United States is carrying roughly four and a half million more disabled people than its own pre-pandemic norm, and the gap is still widening six years on ESTIMATED. Whatever the mix of causes, this is the population that the financing architecture in this report is about — chronically ill, working-age, expensive, authorisation-dependent, and by the RFI's own construction invisible to a document that mentions neither long COVID nor chronic-illness financing in 86 pages. A reform designed around acute episodes is being written for a country that is moving in the opposite direction, and the federal data says so without any help from us.
On cancer, we have now examined the literature directly, and we are still not going to use it. A January 2026 systematic review in Oncotarget (Kuperwasser and El-Deiry, Tufts and Brown) is the most comprehensive analysis to date and does report the pattern: 69 publications, 333 patients across 27 countries, plus population cohorts from Korea (~8.4 million) and Italy (~300,000) and ~1.3 million US military service members, with recurrent themes of "unusually rapid progression, recurrence, or reactivation of preexisting indolent or controlled disease." Three reasons it does not enter this submission. First, the authors themselves characterise the body of evidence as "an early phase of potential safety-signal detection" and call for the epidemiological work that would be needed to establish whether a link exists at all — a systematic review of case reports is a hypothesis-generating instrument, not a basis for a financing argument. Second, and decisively, the review treats COVID-19 infection and COVID-19 vaccination as a single combined exposure throughout. We cannot extract an infection-attributable signal from it, and a health-financing document that appeared to advance a vaccine-injury claim would forfeit the credibility of every other number in it. Third, the popular summaries circulating these hazard ratios attach them to infection alone, which the underlying review does not support. The cancer claim is not asserted, and it is not asserted for reasons we can state rather than for lack of looking.
Why the scale changes the policy conclusion rather than merely decorating it. Everything in Section 9.3 below — the diagnostic ambiguity, the continuous re-authorisation, the appeal that requires the resource the illness removes — describes a mechanism that is costly when it affects a small population and systemically significant when it affects millions of children and working-age adults. A financing architecture that has no vocabulary for contested chronic illness is not missing an edge case. It is missing the fastest-growing category of chronic disease in the country, and it will be scored on outcomes in that population whether or not it names it — which is precisely the argument for the outcome-based rating in 12.10.4.
9.3 Why this population is the system's hardest case
Drawing on the clinical structure documented in our long COVID mechanistic work, five features make contested chronic illness the maximally adverse case in an extraction system. Each connects to a specific mechanism the RFI describes elsewhere.
First, no clean diagnostic code or biomarker. Our mechanistic review's central finding is that long COVID is not one disease but the convergence of four self-amplifying drivers — viral persistence, endothelial damage and microclotting, an autonomic-autoimmune loop, and mitochondrial dysfunction — and that the field's intervention failures are "largely failures of stratification." An illness whose own researchers cannot yet stratify it cannot be adjudicated against a medical-necessity criterion unless the reviewer is given almost total discretion. Discretion is where denial costs least.
Second, a contested and rapidly evolving evidence base. The completed trial record includes a long list of nulls — STOP-PASC, PAX LC, AER002, REGAIN, the NR-LC trial, AXA1125's primary endpoint, RituxME, BC007, HOT-LoCO — alongside positive mechanism-aligned secondary endpoints and responder subsets in several of the same trials. Now apply the RFI's own quality-improvement test language from p078: activities must be "based on evidence-based medicine or widely accepted clinical guidelines." Against an evidence base like that, a payer can deny almost any intervention and quote the literature accurately as it does so. Missing guidelines are not neutral. They are a weapon that points one way, because the patient is the one who has to prove the case.
Third, continuous multi-specialty need, which means continuous re-authorisation. Cardiology, neurology, immunology, autonomic function testing, sleep medicine, rehabilitation, and repeat biomarker panels. Under any prior-authorization regime, the number of authorisations scales with the duration and breadth of illness. The RFI's own figure — 45 prior authorizations per physician per week (p049) — is a provider-side average. For a single patient with continuous multi-system need, the authorisation count is unbounded over time. Burden compounds precisely where illness is most severe. That mechanism is what makes the RFI's single chronic-conditions clause (p051) both the most important and the least developed sentence in its whole prior-authorization menu.
Fourth, interventions that are off-label, off-formulary or non-standard by construction. Low-dose naltrexone, low-dose rapamycin, IVIG, immunoadsorption, hyperbaric oxygen, sulodexide, valacyclovir with celecoxib. Every one is a step-therapy, formulary-exception or experimental-treatment denial waiting to be issued. Hyperbaric oxygen shows most clearly how utilization management turns a dose-response curve into a denial that gets recorded as an approval. The evidence shows benefit at 40 sessions at 2.0 atmospheres and nothing at 10 sessions at 2.4 atmospheres. A utilization-management rule that approves the short course settles the ambiguity against the patient, delivers a dose too small to work, and books an approval. That is Section 8.4's measurement problem at its most concrete: the statistics will show the patient got care.
Fifth, the appeal requires exactly the resource the illness removes. This cohort is working-age, energy-limited, and cognitively affected. Contesting a denial requires sustained attention over weeks, telephone hold time during business hours, document retrieval and articulate written argument. The population-average appeal rate is 0.2 percent (p057). For this group it has to be lower, and nobody has published the figure. Any submission should name that gap and ask for the data.
9.4 The three axes, applied
Axis 1 — care-dollar ratio: worst here. For a patient whose care is continuously re-authorised, the administrative cost per dollar of delivered care is at its maximum. Each authorisation consumes provider time (13.2 minutes), payer review cost, and patient time, to deliver one increment of care. Where the denial-and-appeal cycle repeats, the same increment of care is administered several times before it is delivered once. The population with the greatest care need has the lowest share of its healthcare dollar actually reaching care.
Axis 2 — nominal versus effective access: diverges most sharply here. Every nominal protection holds. The condition is covered; the specialists are in network; the out-of-pocket maximum applies. Effective access fails at every step: no diagnostic code to authorise against, no guideline to cite, no single specialist who owns the case, non-standard interventions, and an appeal process that selects against the patient's core deficit. This is the population for which the RFI's own standard from p014 — "access, afford and receive care" — fails most completely while the coverage statistics look fine.
Axis 3 — gameability: highest here. Every gaming vector is amplified by diagnostic ambiguity. Definitional gaming has maximum latitude where criteria are unsettled. Benefit design can exclude non-standard interventions without appearing discriminatory. Network construction can omit the relevant specialists without breaching an adequacy standard written around primary care and common specialties. Burden-shifting is invisible because there is no measurement of patient-side burden. And the RFI documents the payer's awareness of the incentive: better coverage "would be likely to attract a sicker risk pool and incur higher costs" (p034), and standardised benefit design "limits discriminatory and complex plan design that insurance companies can use to deter people with pre-existing conditions from enrolling" (p046). The RFI knows benefit design is used as a risk-selection weapon against sick people. It says so in one sentence and does not connect it to anything.
9.5 Why this is the case study that demonstrates the whole mechanism
The patient the RFI has in mind enrolls once a year, meets the system for one episode, might shop around, pays a deductible, and either gets the care or does not. Every proposal is built for that person: standardised plans to compare once a year, high-value primary care before the deductible, cost-sharing tuned to influence a single decision, prior-authorization reform written around one request.
Contested chronic illness breaks that model at every point. There is no episode. There is nothing to shop for. Cost-sharing cannot steer a decision the patient is not making. One authorisation becomes a stream of them. The deductible resets every January against a condition that does not.
Applying Brailer's diagnostic completes the argument. He explains that AI compounds only where three conditions hold, of which the decisive one is a fast unambiguous outcome signal. Contested chronic illness has none of the three: no large structured labelled dataset, because the diagnosis is unsettled; no human-in-the-loop correction, because there is no agreed ground truth; and no fast unambiguous outcome signal, because outcomes are slow, multi-dimensional and self-reported. So the one place AI could genuinely help — stratifying an under-characterised illness into treatable subtypes — is exactly where the flywheel cannot spin. Meanwhile the adjudication of that patient's claims sits in revenue-cycle management, where all three conditions hold in full force.
That is the sharpest form of the whole thesis: for the sickest and hardest-to-diagnose patients, AI cannot improve their care and is very well suited to denying it. This is not a forecast. It follows from where the data and the outcome signals sit.
So what? Ask the Committee to add contested-diagnosis and chronic multi-system illness to Section 2, and offer three cheap, specific additions: define "chronic condition" for the p051 prior-authorization limitation; require denial and authorisation reporting broken out by condition category, so condition-specific denial rates can be measured for the first time; and require reporting of authorisations per patient per year, which turns endless re-authorisation from an anecdote into a number.
10. Instrument, authority and litigation durability
Answer first: the remedies in this report do not all require the same kind of legal instrument, and the instrument governs both what has to be built before a remedy can operate and how well it survives review. The range runs from enforcement of obligations already on the books, through appropriations and rulemaking under existing authority, to narrow statute, structural statute, and a new institution with its own funding. Two drafting rules follow. A remedy stated as arithmetic presents a narrower target on judicial review than one delegating a discretionary judgment to an agency. And any claims-data requirement has to be drafted federally, because ERISA preempts the state route — a point the RFI never reaches.
10.1 The instrument each remedy requires
| Instrument | Proposals |
|---|---|
| Nothing new — enforcement of existing law | Directory accuracy (p056); ERISA record production (p058); advance EOBs (p064); interagency inquiry (p085) |
| Appropriations | HCFAC mandatory funding (p067); EBSA staffing (p063); regulator capacity (p085) |
| Rulemaking under existing authority | Bar UM from QIA (p078, 45 CFR 158); QIA classification tightening (p078); denial-reporting expansion for Marketplace plans (p055); AI regulatory parity (absent, per Brailer) |
| Statute, narrow and technical | PTC recapture caps (S.3368, p042); presumptive approval (p052); approval on timeout (p053); automatic external review (p058) |
| Statute, structural | Affiliate benchmarking (p079); fee-based caps (p079); MLR to self-insured (p079); TPA fee structure (p082); independent adjudication (p056); private right of action (p065) |
| Statute, coverage architecture | Public option (p033); buy-in (p036-037); single payer (p038) |
| Statute plus new institution plus appropriations | Commercial oversight entity (p029); independent clearinghouse (p061); independent adjudication entity (p056) — institutional design work is valuable now, and the RFI requests specific proposals on clearinghouse ownership (p061) |
The ordering is the report's instrument-burden scale, and Section 7.1 uses it as the denominator of the lever ranking. Two features of the table matter for drafting. The top row needs no new authority at all, which is why Section 7.4 treats it separately: the obligation already exists in law, so the remedy is enforcement capacity rather than a new instrument. The third row needs no new authority either, but a rule made under existing authority is undone the same way it is made, so a rulemaking remedy carries durability exposure that a statutory one does not.
10.2 Why arithmetic survives review better than discretion
So here is a drafting principle worth putting in the submission: the more a remedy runs on arithmetic and the less it runs on agency judgment, the better it survives court. The reason is doctrinal. A rule that states a formula makes few discretionary findings, so it offers little surface for arbitrary-and-capricious review, which under Motor Vehicle Manufacturers Association v. State Farm asks whether the agency examined the relevant data and articulated a reasoned connection between the facts found and the choice made. A rule that delegates a judgment — whether a rate is excessive, whether a cost is reasonable — has to defend that judgment on the administrative record each time it is exercised. Discretionary rules of broad economic significance additionally invite the objection, under the major-questions doctrine, that the agency was never clearly authorized to decide the question at all. And since Loper Bright Enterprises v. Raimondo ended Chevron deference, an agency's own reading of its authorizing statute no longer carries controlling weight, so the interpretive work has to be done in the text of the statute or the rule rather than by the agency afterwards. ANALYST: a formula narrows all three exposures at once, which is a design choice available at drafting time and unavailable later.
Applied to the items in this report: "Payments to affiliated entities shall be reported at the median price paid to unaffiliated entities for the same service code in the same geography" is an arithmetic instruction. "The Secretary may reject rates determined to be excessive" is a delegation. On durability grounds alone, affiliate benchmarking beats rate-rejection authority — and affiliate benchmarking is also the higher-ranked lever on dollars moved (Section 7.1). The two criteria agree.
10.3 The ERISA preemption blind spot
One structural blind spot is worth naming. Gobeille v. Liberty Mutual Insurance Co., 577 U.S. 312 (2016) holds that ERISA preempts state all-payer-claims-database mandates as applied to self-insured plans. The RFI makes all-payer claims databases its transparency infrastructure (p086) and proposes extending requirements into the self-insured market (p079, p085), and never mentions the case. Any APCD or self-insured reporting proposal has to be drafted as a federal requirement, precisely because state requirements are preempted. This is a technical point that makes the RFI's own proposal stronger, and it is exactly what a comment letter is for. Sections 11.18 and 12.3 carry the drafting instruction that follows from it.
11. All 71 proposals, rated one by one
The full ratings are in Exhibit 1. This section works through the eighteen proposals that carry the analysis, in the RFI's order. Each one gives: what is proposed, with the page; the three axis ratings and why; GOOD (what our research backs up); BAD (the specific way it gets gamed, or the misdiagnosis, or the treating-a-symptom error); OMITTED; our evidence; and a verdict with a concrete recommendation.
11.1 Enhanced rate review covering administrative cost growth and utilization management (p020)
Proposed. Build on ACA rate review by "evaluating annual increases in administrative costs and the use of utilization management practices that delay care and drive up consumer spending without demonstrating an improvement in patient safety or reduced costs," requiring expanded data submission to states (p020, citing Corlette and Raimugia, Georgetown, September 2023).
Axis 1: STRONGLY POSITIVE. This is the only place in 86 pages where utilization management has to prove it saves money. It puts the burden of proof on the plan for the biggest single source of administrative cost.
Axis 2: IMPROVES. If UM must demonstrate improved safety or reduced cost to be recoverable in rates, the volume of unjustifiable UM falls, and effective access rises directly.
Axis 3: MEDIUM. Vector: the insurer writes the analysis it hands in. Without a specified data schema and an independent analyst on the other side, "demonstrating" means filing a favourable actuarial memo. Second vector: the RFI itself says states lack the resources and "forgo the use of authorities... even when there is good reason to consider doing so" (p020). A requirement aimed at a regulator with no analytic capacity does not bind. Time to production: immediate, because this is already how it works.
GOOD. Corroborated at the mechanism level. The RFI's own inference at p054 is the strongest available support: the voluntary prior-auth reductions "have not had an effect on premiums, which suggests that changes may have addressed certain arbitrary barriers to care that caused delays but were often overturned." An 11 percent reduction in prior-authorization volume with no premium effect is a natural experiment demonstrating that the removed UM had no cost-control value. That is precisely what this proposal would force plans to prove prospectively.
BAD. It asks a regulator that cannot do the analysis to do the analysis. And it is missing the definitions that would make it work: "administrative costs" is never defined, so a conglomerate can move administrative functions into an affiliate whose bills show up as medical or vendor expense — the Section 6.5 vector, at work here.
OMITTED. No requirement that UM data be reported publicly or in comparable form; no denial-and-overturn data in the rate filing, which is the one dataset that would make the justification testable; no federal analytic body to review filings, though the RFI proposes one twenty pages later at p029 without connecting the two.
Our evidence. $370 billion administrative cost, over half wasteful (p059) SOURCED; $812 billion on the Himmelstein and Woolhandler definition SOURCED37; $18 billion in avoidable hospital rework (p060) SOURCED46; 70 to 81 percent overturn rates SOURCED.
Verdict: the right idea, written too loosely to work. Recommend: require rate filings to include, per service category, UM volume, UM administrative cost, denial rate, appeal rate, overturn rate, and mean elapsed days to determination; require the filing to state claimed savings net of UM administrative cost; and provide that where the plan does not produce the data, the cost increase is presumed unjustified. Pair it explicitly with the p029 oversight entity, which is where the analytic capacity the states lack would live.
11.2 Capped rate increases (p021)
Proposed. "Allowable annual rates could be capped at a flat percentage growth rate, or benchmarked to medical trend, in order to eliminate premium spikes and create additional incentives to control costs" (p021, citing Spiro et al., Center for American Progress, April 2026).
Axis 1: INDETERMINATE. A premium cap limits how much money comes in. It says nothing about how that money gets split. The care-dollar ratio can fall under a premium cap, if the insurer cuts care spending faster than revenue.
Axis 2: INDETERMINATE, and it could easily get worse. The premium is the price people see. Network breadth, deductible level and UM intensity are the prices they do not. Squeeze the visible one and the insurer squeezes the invisible ones.
Axis 3: HIGH. Vectors, all concrete: narrow the network (the RFI documents ghost networks at p048 and repricer incentives to keep providers out of network at p083); raise the deductible (p011 documents individual-market deductibles rising 37 percent in one year); intensify UM; degrade the benchmark plan so the cap binds on a worse product; or exit the market — which the RFI documents insurers already doing (p028). Time to production: one plan-year filing cycle.
GOOD. The underlying diagnosis is right. Karaca-Mandic et al., cited at p021 fn 74, find that states with stronger rate-review authority experienced lower premiums, so rate regulation as a category has empirical support.
BAD. This is the clearest instance of symptom-versus-disease error in the document. The premium is a symptom; the retained share is the disease. The RFI supplies its own disconfirming evidence: of the three state public options it reviews, Colorado "has not met its established premium reduction targets" (p030) and Washington "identified initial premium reduction targets that have not been met" while "experienced challenges establishing broad networks" (p031). Two of two mature premium-focused programmes missed their targets, and one made its network worse. The RFI reports this honestly, to its credit, and then proposes a bigger version of the same thing.
OMITTED. No cap on the retained share, which is the equivalent instrument on the correct variable — and which the RFI proposes twenty-eight pages later at p079 as fee-based caps, without connecting the two.
Our evidence. Individual-market deductibles up 37 percent in one year (p011) SOURCED; MOOP heading to $15,600 and $31,200 (p025) SOURCED; ghost networks (p048) SOURCED; repricer incentive to keep providers out of network (p083) SOURCED.
Verdict: do not pursue as designed. Recommend: convert to a cap on the non-care share. If a premium-side cap is retained for any reason, it has to come with a floor on the care-dollar ratio, network-adequacy standards tested by whether patients can actually get appointments rather than by directory listings, and a deductible cap. Otherwise the cap just moves the cost onto patients and gets reported as a win.
11.3 Prohibiting or limiting coinsurance as a utilization management tool (p024)
Proposed. Three options: prohibit coinsurance as a UM tool; limit it to genuinely shoppable services where consumers can actually shop; or require insurers to provide data and analysis demonstrating that coinsurance is an evidence-based tool to encourage use of higher-value, lower-cost care (p024).
Axis 1: MARGINAL. Moves cost from the patient to the plan. That raises the plan's share of the bill but does not cut non-care spending on its own.
Axis 2: IMPROVES, materially. Coinsurance on hospitalisation and emergency care "can amount to thousands of dollars" (p021) for care no patient chose. Removing it directly improves effective affordability.
Axis 3: MEDIUM. Vector: switch to copayments, restructure the deductible, or simply exclude the benefit. The RFI handles deductibles and out-of-pocket maxima elsewhere, which narrows the room to substitute, but it leaves the exclusion route wide open.
GOOD. The analytical framing is the best in Section 1: "The expanding and unpredictable nature of the types and costs of care subject to coinsurance... suggests that coinsurance is being used for reasons other than to influence decision-making or encourage the use of higher-quality care" (p024). The third option is the one that matters, because it is the second place in the document where the burden of proof gets flipped onto the plan — the first being rate review at p020. The RFI has half-found a general rule: make whoever imposes an obstacle prove it is worth having. It uses the rule twice and never says it out loud.
BAD. It is written as a consumer-protection measure instead of as an example of that rule, which keeps it small. Options one and two can be substituted around. Option three cannot, and it is listed last.
OMITTED. The general rule. Every obstacle the RFI catalogues — coinsurance, prior authorization, step therapy, serial information requests, appeal procedure — could be made to meet the same evidence test. One legislative principle could replace a dozen procedural fixes, and the document never states it.
Our evidence. Nearly 40 percent of insured people delayed or skipped care they could not afford (p011) SOURCED; nearly half received a bill for care they expected to be covered (p011) SOURCED; deductibles applied to emergency and inpatient care "cannot influence patient behavior" (p023) — the RFI's own words.
Verdict: adopt, and generalise. Recommend the submission propose a uniform evidentiary standard: any cost-sharing or utilization-management instrument applied to non-shoppable or non-elective care must be supported by plan-submitted evidence that it improves safety or reduces total cost of care net of administrative cost, or the plan may not impose it. That one principle covers proposals 1.9, 1.10, 2.3, 2.4 and most of 2.5 to 2.10, and it is much harder to game than any of them separately, because it puts the burden on the party that holds the data.
11.4 Commercial-market oversight entity, a MedPAC analogue (p029-030)
Proposed. "Establish an entity similar to the Medicare Payment Advisory Commission (MedPAC) and [MACPAC] that would evaluate behaviors and trends in the commercial market and recommend reforms on an ongoing basis" (p029, citing Lambrew, The Century Foundation); and an "independent entity that would evaluate coverage and affordability across private insurance markets" (p030). The RFI is "particularly interested in feedback on how to structure an oversight and reporting entity to maximize its authority to review and analyze cost and other data" (p030).
Axis 1: STRONGLY POSITIVE, as an enabler. It moves no money by itself, and almost nothing that does move money works without it.
Axis 2: INDETERMINATE. No direct effect on access.
Axis 3: LOW. An analytic body with data access and a duty to publish is hard to game, because what it produces is analysis rather than a number to stay under. What remains is capture through appointments and budget — which is why the RFI's own Federal Independence discussion at p039 belongs in this section, and is absent from it.
GOOD. Strongly corroborated. On our reading this is the most important structural ask in the RFI, and the RFI makes the argument for it itself at p085: new transparency requirements on the self-insured market "may yield data and information that DOL lacks the resources and expertise to review and act on." Disclosure with nobody able to read the disclosure produces nothing. MedPAC proves the concept — our own most important carried correction, revising Medicare Advantage overpayment from $83 billion to $76 billion and from 22 percent to 14 percent, exists because MedPAC measures it every year and CMS acted on that measurement through the v28 risk model. That is a documented case of a standing analytic body cutting extraction by a measurable amount. There is no such body for the commercial market, which covers roughly 180 million people.
BAD. Where it sits and how it is framed. It turns up in Section 1.III under coverage pathways, beneath the subhead "Improving oversight of existing private insurance markets" (p029), rather than in Section 3 or in the system-wide transparency section at p085 where it actually belongs. A reader trying to assemble the RFI's transparency architecture would never find it.
OMITTED. Independence protections — even though the RFI raises exactly that concern for federal benefit administration at p039, naming the sidelining of ACIP and USPSTF experts. Look at the double standard: the RFI demands scientific independence for a public plan's benefit decisions and asks for none from the internal medical-policy committees of private plans covering 180 million people. Also missing: authority to get the data, without which the new entity is a literature-review shop.
Our evidence. MedPAC's measurement-to-action chain on Medicare Advantage SOURCED; the RFI's own capacity concessions at p077, p085 and p063.
Verdict: this should be the submission's institutional recommendation. Recommend: a Commercial Market Payment Advisory Commission with (a) statutory authority to compel transaction-level data from insurers, TPAs, PBMs and affiliated entities, without exceptions for proprietary treatment — the precise gap identified at p074; (b) an annual public report with a required care-dollar-ratio computation by carrier and market; (c) a de-identified transaction-level research file; (d) appointment and budget protections modelled on the independence concerns the RFI raises at p039; and (e) an explicit mandate to audit automated adjudication systems, which is where Brailer's transparency remedy would live institutionally.
11.5 Prior authorization: gold carding (p051)
Proposed. Exempt providers with sufficiently high historical approval rates; over a dozen states have adopted a version; some advocates propose extending it to all in-network providers "since they have presumably gained the confidence of an insurer in order to be brought in-network" (p051).
Axis 1: MARGINAL. Cuts UM volume for some providers.
Axis 2: IMPROVES for patients of exempted providers; UNCHANGED for everyone else.
Axis 3: HIGH — the easiest thing to game in the whole prior-authorization menu. Vector: the payer sets both the bar and the score that decides who clears it. If gold carding needs a 95 percent approval rate, the payer can push observed approval rates down with stricter criteria, or put the bar where almost nobody clears it, or apply it only to low-volume services — a worry the RFI itself notes. The RFI also cites Texas Medical Association material on implementation fights (p051, fn 210), which is evidence the gaming is already happening in the states that adopted it. Time to production: already in production.
GOOD. The version the RFI mentions almost in passing is the good one: exempt all in-network providers by default. That is presumptive approval (proposal 2.7) reached from another direction, and it takes the bar out of the payer's hands altogether.
BAD. Gold carding as usually designed lets the regulated party decide who gets out of its own regulation. It also turns UM from something everyone faces into something some providers face, which creates a second problem: providers whose patients are sicker and more complicated will have lower approval rates for perfectly good clinical reasons, and will never qualify. So gold carding piles the paperwork onto the providers whose patients are sickest — the Section 9 mechanism, running through a reform meant to help.
OMITTED. Any rule on how the qualifying rate is calculated or who audits it. Any acknowledgement of the case-mix problem.
Our evidence. The clinical-complexity gradient argument (Section 9.3); the RFI's own concession about low-volume services and qualification thresholds (p051).
Verdict: reject the conventional design; adopt the in-network variant. Recommend the submission say plainly that gold carding as most states have built it is controlled by the payer, and that the only version worth defending is the one the RFI buries in a subordinate clause: being in-network is the gold card. That is proposal 2.7, and we should argue it directly instead of through this stand-in.
11.6 Prior authorization: limitations or bans, including for chronic conditions (p051)
Proposed. Limits or bans "in specific circumstances such as for chronic conditions, time-sensitive treatments where a delay would likely worsen a patient's prognosis (such as treatment for cancer), certain preventive screenings, or specific classes of drugs or treatments, similar to actions taken in Oregon and other states" (p051).
Axis 1: MARGINAL. Removes UM cost for defined categories.
Axis 2: IMPROVES substantially for the covered categories. This is the highest-value effective-access proposal in the menu for the population identified in Section 9 — if the categories are defined.
Axis 3: HIGH, entirely through definitional gaming. Vector: "chronic condition" is undefined in the RFI and, if left to plan definition or to a narrow enumerated list, the population excluded from the protection will be exactly the population that most needs it — patients with contested, multi-system, or newly described illness. Let a payer define "chronic condition" and it will define it around well-coded conditions with settled guidelines. Time to production: while the bill is still being drafted.
GOOD. The category-based approach is correct and has state precedent — Oregon SB 463 (2023) on proton beam therapy, an Oregon HIV-treatment bill, and a January 2026 action by Governor Healey in Massachusetts (p051, fn 211).
BAD. It is one clause in a for-example list. This is the only time chronic illness appears in 86 pages (Section 9.1). The RFI gives no definition, no mechanism, no way to identify who qualifies, and no reporting requirement that would let anyone tell whether the protection worked.
OMITTED. Everything needed to make it work. Also missing: any sign that the drafters noticed chronic conditions are a different kind of thing from the other three items on the same list. Cancer treatment, time-sensitive care and preventive screening are episodes — they start, they end, they have codes and guidelines. Chronic multi-system illness is a condition you live in — no end date, sometimes no code, often no guidelines. One exemption clause covering both misses the difference, because what actually crushes a chronic patient is not one blocked authorisation but an endless run of them.
Our evidence. The full Section 9 mechanism argument; the verified zero counts for long COVID, ME/CFS, chronic illness and post-viral illness; the qualitative clinical structure from our long COVID work. We disclose in Section 9.2 that no published condition-specific denial rate exists.
Verdict: the most important underdeveloped proposal in the RFI. Recommend three specific, low-cost additions: (a) define chronic condition functionally rather than by enumeration — for example, a condition requiring ongoing care across two or more specialties for twelve months or more, which captures contested illness without requiring a settled diagnostic code; (b) require reporting of authorisations per patient per year, stratified by condition category, converting continuous re-authorisation from anecdote to statistic; (c) provide that where a condition meets the functional definition, an authorisation once granted persists for the duration of treatment or twelve months, whichever is longer, which addresses the actual burden.
11.7 Presumptive approval of in-network care, burden shifted to the plan (p052)
Proposed. "Rather than requiring a doctor to justify their clinical decision-making to an artificial intelligence chat bot, or a human reviewer who has no experience in their practice area, in-network care would be presumptively deemed medically appropriate unless a health plan's clinical review team can demonstrate a patient safety issue or lack of medical necessity." Plans could "retrospectively audit outlier behaviors and subject outlier providers to additional prior authorization requirements" (p052, citing Keith, "Insurer Accountability").
Axis 1: STRONGLY POSITIVE. Wipes out a big share of the $35 billion prior-authorization processing cost and of the $18 billion in avoidable hospital rework, on both sides of the transaction.
Axis 2: IMPROVES, and it is the largest single effective-access gain available in the document. It removes delay at the point where delay does clinical damage.
Axis 3: LOW — and this rating is the important one. Automation wins because the payer acts for free while the patient has to spend real time and money. Presumptive approval kills that advantage by making doing nothing favour the patient. Now the plan has to spend money to deny, and spend it on a clinical review team that produces a finding it can show. Two real but limited ways round it: shrink the network so less care counts as "in-network" — which is why this needs enforced adequacy standards alongside it — and abuse the retrospective outlier audit to rebuild prospective UM aimed at particular providers, which is why outlier status needs a published method and a right of appeal.
GOOD. Well supported, and it is the RFI's best idea. Three separate reasons. The 70 to 81 percent overturn rate means the current default is wrong most of the time anyone checks it, so flipping it moves towards accuracy, not away. The 16 percent qualified-reviewer figure (p052) means the process today does not produce the clinical judgment it claims to. And the RFI's own natural experiment at p054 — an 11 percent voluntary cut in prior authorization with no effect on premiums — says much of today's UM saves nothing, so scrapping the default costs little.
BAD. Nothing structural. Two drafting risks: "in-network" becomes the new line to fight over, and "clinical review team" is left undefined, so one credentialed signatory rubber-stamping machine output would satisfy the words. That second one is how Brailer's regulatory-parity problem walks back into the RFI's best proposal.
Our evidence. 70 to 81 percent overturn SOURCED; 14 hours per 45 authorizations (p049) SOURCED; $18 billion avoidable rework (p060) SOURCED46; $35 billion prior-authorization processing (Vol 2); Brailer on why default inversion is durable where process addition is not.
Verdict: the strongest proposal in the RFI. Back it without reservation, and add three drafting fixes. Recommend: (a) the plan must produce its demonstration within a fixed period from the service or the request, and no information request may reset the clock — importing the p053 fix; (b) the demonstration must be specific to that patient, made by a board-certified clinician in the relevant specialty, and kept as an auditable record naming the reviewer; (c) outlier status must follow a published method with a provider right of appeal. Also ask the Committee to tie this proposal explicitly to the automation problem, because it is the only proposal in the document that actually solves it.
11.8 Approval on timeout, with penalties for clock gaming (p053)
Proposed. Time restrictions on determinations, with safeguards against "insurers gaming systems to circumvent prior authorization time requirements by manufacturing artificial pauses or resets of the decision clock," via "fees or other escalating penalties" or "deeming any prior authorizations presumptively approved if they are not resolved within reasonable time frames" (p053).
Axis 1: MARGINAL. Cuts the cost of delay. Does not move the premium dollar.
Axis 2: IMPROVES. Goes straight at delay — the harm the RFI otherwise cannot measure.
Axis 3: LOW if the clock is un-resettable; HIGH if it is not. The rating turns entirely on one drafting decision. The RFI names the vector in the same paragraph, and describes the identical tactic on the claims side at p060: "each new request for information, denial justification, or medical necessity review restarting the process and the timeline." A version of this rule that permits information requests to pause the clock recreates the problem it solves.
GOOD. Credit the RFI for anticipating a gaming response to its own proposal. This is the only place in 86 pages where it does so, and the instinct is exactly right.
BAD. The RFI offers penalties and approval-on-timeout as alternatives ("Potential solutions could include..."). They are not alternatives. A penalty can be priced in and paid; an automatic approval cannot. A per-violation fee turns into a line item, and at automated volume the numbers say pay the fee.
OMITTED. When the clock starts and what can stop it — which is the whole substance of the rule. Also missing: the same rule on the claims-payment side, even though p060 documents the same trick there.
Our evidence. The RFI's own two descriptions of clock manipulation (p053, p060); the float argument (gap G6); the delay measurement gap (Section 6.4).
Verdict: adopt, with the clock rule specified. Recommend one sentence: the determination period runs from the provider's first request, and no information request, peer-to-peer scheduling or internal review step pauses, extends or restarts it. Choose automatic approval over penalties, and apply the same rule to claims payment. If both are used, the penalty should scale with the number of timeouts rather than being charged case by case, for the reason given in Section 8.7.
11.9 Codifying the 2025 voluntary industry prior-authorization pledge (p053-054)
Proposed. The RFI describes the June 2025 industry pledge — standardised electronic submission, reduced volume of services subject to prior authorization, honouring existing authorisations during transitions, enhanced transparency, real-time approvals for most requests by 2027, and ensuring medical professionals review all clinical denials (p053, citing HHS, June 23, 2025) — reports that the companies claim these changes produced an 11 percent reduction in prior authorization use (p053, AHIP, April 2026), notes that most physicians do not believe the changes will make a meaningful difference, and asks "whether these consensus reforms should be codified" (p054).
Axis 1: NEUTRAL. Does nothing to how the premium dollar gets split.
Axis 2: INDETERMINATE. Cannot be evaluated. The RFI says so itself: "Absent additional information, we are not able to evaluate the significance or effect of these voluntary changes" (p054).
Axis 3: HIGH. Vector: the industry picks the measure, sets the denominator and reports the answer. You get an 11 percent cut in prior-authorization volume by dropping authorisation on services you were approving 99 percent of the time — which cuts volume, cuts the payer's own admin cost, improves the headline number, and changes nothing at all about contested care. The RFI's own reading at p054 comes within an inch of saying so: the reforms "have not had an effect on premiums, which suggests that changes may have addressed certain arbitrary barriers to care that caused delays but were often overturned." The cut landed on the authorisations that never mattered. Time to production: already done; this is a description of what happened.
GOOD. The RFI is right to be sceptical and its inference at p054 is sharp. Also good: it asks the insurers directly for the underlying data (p054).
BAD. Writing a self-measured promise into law turns a voluntary number into a statutory one without fixing the measurement. The pledge's most substantive item — "ensuring medical professionals review all clinical denials" — is the easiest to satisfy with a signature, per Exhibit 2. And the pledge's most concrete commitment, "real-time approvals for most requests by 2027," is a promise to automate. The RFI reports that without noticing that the industry has publicly promised to do more of exactly what the RFI says one page earlier may be driving improper denials (p053).
OMITTED. That observation. Also missing: any requirement to break the 11 percent down by service category and by prior approval rate, which is the only way to tell whether it means anything.
Our evidence. PSI's finding that authorisation volume rose eighteenfold for home health while denial rates there fell (Section 8.2) is the direct analogue: volume and denial statistics can move in opposite directions while access worsens. 2025 AMA survey scepticism (p053).
Verdict: do not codify as written. Recommend the submission answer the RFI's p054 question head-on: codify the pledge only with (a) any claimed volume reduction broken out by service category and prior approval rate, (b) a definition of "medical professional review" that requires a patient-specific auditable record naming a same-specialty board-certified reviewer, and (c) a standard for automated determinations — Brailer's regulatory parity. Without (c), "real-time approvals by 2027" is a promise to do faster the exact thing the RFI worries about at p053.
11.10 Independent claims adjudication entity (p056, p059)
Proposed. "Remove plans from claims adjudication altogether due to their inherent conflict of interest, replacing the existing system with an independent claims adjudication entity that would evaluate medical necessity and establish claims adjudication frameworks. Insurers would continue to establish contracts and evaluate claims, but would be removed from determinations of medical necessity" (p056). Echoed at p059 as "a Medicare-style third-party claims adjudication entity."
Axis 1: STRONGLY POSITIVE. Takes the money interest out of the decision and scraps the duplicate war machines on both sides — the arms race Brailer describes, where providers buy AI to appeal and insurers buy AI to fight the appeals, "converting clinical dollars into administrative ones."
Axis 2: IMPROVES. Having a party with no stake make the call is the structural fix for both denial and delay.
Axis 3: LOW on the core mechanism. What is left: the entity's criteria become the new place to apply pressure, so its governance and independence are the whole ballgame; and plans keep contracting and network design, so the money moves to network construction and affiliate pricing — which is why this has to travel with the Section 3 remedies.
GOOD. Strongly corroborated as the highest-ceiling structural remedy short of coverage-architecture change. The RFI's own predicate is unanswerable: "the arbiters of this process are health plans that can generate revenue by denying claims" (p055). Our evidence adds the magnitude: 70 to 81 percent overturn rates mean the current arbiter is wrong most of the time its work is examined, and the p062 natural experiment shows that its error rate varies with regulatory exposure rather than with clinical facts.
BAD. No design is offered, and the hard questions are all institutional: who funds it, how it handles billions of claims a year, who sets the criteria, how you appeal its own decisions, and how it squares with ERISA. The RFI asks for feedback on the design (p056) instead of proposing one.
OMITTED. Any way to get there in stages. The full version is a decade of institution-building. A narrow version — independent adjudication only for high-cost or contested medical-necessity decisions — is doable now, and goes undiscussed.
Our evidence. 70 to 81 percent overturn SOURCED; $18 billion avoidable rework (p060) SOURCED46; $25.7 billion provider claims adjudication cost SOURCED46; the RFI's 9 billion claims at $12 to $19 payer-side (a denominator we contest at Section 4 — Premier puts adjudicated medical claims at ~3 billion) (p060) versus $97 to $107 combined (Premier) SOURCED; the p062 natural experiment.
Verdict: right in principle, needs to be built in stages. Recommend the submission lay out a phased path: start with independent external review of every medical-necessity denial above a dollar threshold, which is proposal 2.15 in institutional form and needs no new entity; then extend to first-instance adjudication for named high-cost categories; and run it through Medicare administrative contractors, which the RFI itself suggests in another context at p083. Pair it with affiliate benchmarking, or the money simply moves to network and pricing.
11.11 Automatic external review without patient initiation (p058)
Proposed. "Implementing an automatic independent appeal and review process where a consumer would no longer need to initiate these steps on their own. This could incentivize insurers to improve their internal claims review processes" (p058).
Axis 1: STRONGLY POSITIVE. Turns money wrongly kept on denied claims into claims that get paid. Our estimate: $3 billion to $34 billion a year in the Marketplace in-network universe alone.
Axis 2: IMPROVES. Directly — and it helps most the patients least able to fight for themselves, which turns the current gradient upside down.
Axis 3: LOW. Best impact for the difficulty of anything in the document. You cannot beat it by wearing patients down, because wearing patients down is the thing it abolishes. What is left: capture of the external review body, which the RFI itself flags — "determinations of eligibility for external appeals are often adjudicated by entities that contract with the health plan itself" (p054) — and the shift from denial to delay, since a claim not yet denied cannot be reviewed. Both can be fixed in drafting.
GOOD. Well supported — on the appeal rate, which needs no cross-universe comparison to carry the point. Two tenths of one percent of Marketplace denials were appealed on 2021 data and under one percent in 2024, and the patients who do appeal lose about two thirds of the time. A right exercised by one claimant in a hundred, and lost by two thirds of those, exists on paper only. Automatic review is the one proposal in the RFI that turns a paper right into a real one, by taking the patient out of the loop. It is the clearest example in the document of the difference between what coverage says and what patients get.
BAD. It arrives in a sub-bullet, hedged as "This could incentivize," with no scope, threshold, funding or timeline. And the captured-reviewer problem the RFI names at p054 goes unaddressed here, four pages later.
OMITTED. Who pays. The answer is the plan, scaled to its overturn rate, which makes the review system a self-funding penalty on wrongful denial and puts the volumetric-liability principle from Section 7.3 straight into practice. The RFI does not discuss funding at all.
Our evidence. 0.2 percent appeal rate (p057) SOURCED; fewer than 1 in 20,000 reach external review (p057) SOURCED; 70 to 81 percent overturn SOURCED; the monetised gap derivation in Section 7.2; Yaver's rationing-by-inconvenience framework, cited three times by the RFI.
Verdict: with proposal 2.7, the two most important remedies in the document. Elevate both. Recommend: automatic external review for all denials of medical necessity, funded by a per-review fee on the plan that escalates with the plan's trailing overturn rate; external reviewers selected from a roster the plan does not control, addressing the p054 problem; and reviewer decisions published in de-identified form to build the criteria dataset that currently does not exist. The escalating fee is the cheapest way to make volumetric liability real, because it needs no new enforcement machinery at all — the plan's own error rate produces the penalty.
11.12 Independent billing and coding clearinghouse (p061)
Proposed. "An independent entity responsible for standardizing coding and billing processes into a single clearinghouse that would allow providers and hospitals to interact with one predictable system rather than the processes imposed upon them by multiple insurance companies." The RFI "request[s] specific proposals on the type of entity that should own and operate such a clearinghouse" (p061) — one of the few requests for specific proposals in the document.
Axis 1: STRONGLY POSITIVE, and the highest ceiling of any administrative remedy. It goes after the thing that creates the cost — every payer running its own system — instead of the cost itself.
Axis 2: IMPROVES indirectly, by cutting the friction that causes delay and lifting the burden that lands hardest on small and rural providers (p060).
Axis 3: LOW on the core function. A standard is hard to game because breaking it is visible by definition. What is left: plans piling their own requirements on top of the standard, which is exactly how today's electronic-transaction standards got absorbed — a real risk, fixed by banning plan-specific extras on standardised transactions.
GOOD. This is where the international comparison is decisive, and it is evidence we hold and the RFI does not use. Germany operates 96 competing sickness funds with one fee schedule and one benefit package, at administrative cost of roughly 4.2 percent of spending versus 8.3 percent in the United States, and per-claim processing of roughly €5 to €10. Canada's provincial systems process claims at an estimated $2 to $6, and Canadian physicians spend roughly $22,205 per year on billing against $82,975 for US physicians. Germany is the important case because it is multi-payer. It demonstrates that the American cost is not what competition costs. It is what refusing to standardise costs. That single distinction kills the main objection to this proposal.
BAD. No design offered, and the RFI knows it — hence the request for proposals. Ownership is the whole question: an industry-owned clearinghouse just rebuilds the problem, and today's clearinghouses are already part of the extraction chain, showing up in our own model as an $8 billion line.
OMITTED. The connection to Section 3. Revenue-cycle-management companies and repricers, which the RFI describes at p083 to p084 as profiting from complexity they and their affiliates create, are the entities whose business model a clearinghouse would eliminate. That is simultaneously the strongest argument for the proposal and the precise source of the opposition it will meet, and the RFI does not make the connection.
Our evidence, with its limits stated. The comparative case is real but thinner than a single line of labels would suggest, so the caveats travel with the figures:
- US combined $97 to $107 per claim SOURCED (Premier, provider-side $57.23 in 2023 plus $40 to $50 payer-side). This unit cost must not be multiplied by 9 billion. Premier's own reporting puts adjudicated medical claims at "about three billion" annually; the 9 billion figure counts all administrative transactions. Pairing a contested-claim unit cost with an all-transactions denominator overstates by construction — the same error we identify in the RFI at Section 4, and we do not repeat it.
- Canada $22,205 versus US $82,975 in physician-practice payer-interaction cost — Morra et al., Health Affairs 30(8):1443-50, 2011 ESTIMATED. Not Himmelstein et al. 2020, which is a different study. Two limits: the data are 2011 and Ontario-only, and the figure is per physician per year, not per claim — it does not belong in a per-claim comparison without that qualifier.
- Germany 4.2 percent, Canada 2.8 percent, NHS roughly 1 to 2 percent administrative overhead ANALYST — these come from our own Volume 2 exhibit, which carries no resolvable underlying reference and is internally inconsistent on the NHS figure (1.9 percent in one place, 2 percent in two others). Directionally robust and consistent with the wider literature; not a citable third-party measurement.
- Germany €5 to €10 and Canada $2 to $6 per claim ANALYST. We could not verify these against any source. They are load-bearing for the argument that standardisation rather than competition produces low administrative cost, and a submission should either substantiate them or drop them.
- Clearinghouse fees $8 billion ANALYST (Volume 2).
The argument survives these corrections — a 4-to-8-fold US-to-peer gap in per-claim administrative cost is not sensitive to any one of them — but each figure should carry its caveat rather than a bare label.
Verdict: answer this ask directly. It is one of the few explicit requests for a specific proposal and we hold the comparative evidence. Recommend: a federally chartered non-profit utility with a board excluding entities owned by or affiliated with insurers, PBMs, TPAs or revenue-cycle-management firms; mandatory use for all standardised transactions; a statutory prohibition on plan-specific supplemental requirements for those transactions; and funding by per-transaction fee set to recover cost. Cite Germany as the existence proof that multi-payer competition and standardised billing are compatible.
11.13 Consequential remedies and a private right of action (p065)
Proposed. Four items: a tailored private right of action against plans across private markets; a federal framework of fiduciary duties and standards of review for plans and TPAs making medical-necessity determinations; penalties for repeat offenders including market exclusion; and reviving proposals to "eliminate incentives to use so-called cost control strategies as a way to generate profits at the expense of providing care" (p065).
Axis 1: STRONGLY POSITIVE. Changes what a wrongful denial costs, and that is the number that sets how many denials get made.
Axis 2: IMPROVES, but indirectly and slowly.
Axis 3: LOW on the mechanism, MEDIUM in practice. A liability rule is hard to game head-on. The ways round it: limit remedies by contract where that is allowed; arbitration clauses; and, the big one, a patient still has to bring the case, so it inherits the 0.2 percent problem. Any liability that has to be invoked one patient at a time gets priced against the odds anyone invokes it.
GOOD. The RFI's diagnosis here is the sharpest passage in the document and deserves quoting in full because it is the analytic core of the whole denial economy (p065):
"Financial recovery for improper denials is generally limited to the cost of the claim or benefit that was denied. This limited recovery likely creates a disincentive for consumers to pursue recovery, and a corresponding incentive for profit-seeking health insurance companies to deny care... that patient can generally only recover the costs of the denied claim minus their cost-sharing. This is true even in instances where insurance company decision-making led to worse health outcomes or irreversible harm. Patients generally cannot recover costs for any subsequent treatment, or even recoup medical expenses that were caused by the improper denial or delay."
That is the whole machine in one paragraph. A wrongful denial costs the insurer the claim amount times the chance anyone appeals — about 0.2 percent of the claim — and every downstream cost gets dumped on the patient, the provider and other payers. At that price, denying is the rational move, and automation makes it cheaper still.
BAD. These remedies work one patient at a time; the harm happens in bulk. A private right of action reaches the 0.2 percent of cases someone fights and never touches the other 99.8 percent. History matters here too: the RFI itself cites CRS analysis of the 2001 Patients' Bill of Rights fight (p065, fn 276), which lost. Bringing back a proposal that lost twenty-five years ago, against an industry with more money now, without changing anything about it, is not a plan.
OMITTED. Volumetric liability — the biggest hole in the document, per Section 7.3. All four of the RFI's items wait for someone to bring a case. The missing fifth is a bill that comes due on the total count of denials overturned on review, owed whether or not any patient lifts a finger. Put it with automatic external review (11.11) and it runs itself: automatic review produces the overturn count, and the count produces the bill.
Our evidence. The p065 passage; 0.2 percent appeal rate; 70 to 81 percent overturn; the Section 7.2 derivation; PSI's documentation of denial-rate increases following automated review; the Lokken allegations, at the evidentiary level stated in Section 8.6.
Verdict: adopt the fiduciary-duty item, deprioritise the private right of action, and add volumetric liability as the headline. Recommend the submission's single most important substantive proposal: a plan must pay, per denial overturned on independent review, the value of the claim plus a multiplier of the documented downstream cost, with the multiplier escalating with the plan's trailing overturn rate. No patient action required. This is the only instrument identified in this analysis that makes the marginal cost of an automated denial rise with its volume, and it is therefore the only one that cannot be optimised around by doing more of the same thing faster.
11.14 Barring utilization management from quality-improvement classification (p078)
Proposed. One of five QIA bullets: "Prohibiting the classification of utilization management activities as QIA given concerns related to the use of utilization management as a barrier that generates profit" (p078).
Axis 1: STRONGLY POSITIVE. This holds up the entire MLR structure. Today the MLR numerator is claims plus quality-improvement activities. So if utilization management — the work of not paying claims — counts in the numerator, then the money spent denying care is booked as care. Take it out and the MLR numerator finally means what it says, which has to happen before any other MLR remedy can work.
Axis 2: IMPROVES. Stops paying insurers, in accounting terms, for doing more UM — so they do less of it.
Axis 3: LOW. Vector: rename UM as something still allowed — "care management," "care coordination," "clinical programs." A genuine risk, beaten by requiring each activity to pass the four-part test with measured outcomes, which the RFI's fourth QIA bullet already proposes (p078). Time to production: one reporting cycle, if that evidence requirement is missing.
GOOD. Strongly corroborated, and the RFI documents the scale of the underlying corruption in the same passage. Under existing QIA rules, plans have classified "untargeted provider bonuses, general marketing, overhead and lobbying" as quality improvement (p078), amounting to "hundreds of millions of dollars each year." Lobbying booked as quality improvement is the definitive proof that MLR as currently constituted cannot serve as a care-dollar measure: an expenditure whose purpose is to change the rules counts, under the present definition, as an expenditure on care.
BAD. Nothing wrong with the proposal. Everything wrong with where it sits: third of five bullets under "Senate Democrats invite feedback and comments," inside a subsection of Section 3.III, and never flagged as the thing that has to happen before the MLR modernisation options on the very next page can work.
OMITTED. An affirmative enumeration of what does not count, which the RFI's fifth bullet gestures at. Also omitted: the connection to Section 2. The RFI spends eleven pages establishing that utilization management is a profit-generating barrier and then treats its accounting classification as a technical footnote. These are the same fact.
Our evidence. $370 billion administrative cost, over half wasteful (p059) SOURCED; $35 billion prior-authorization processing (Vol 2); 20 percent retention versus Medicare's under 2 percent (p076) SOURCED18; traditional Medicare implied MLR above 97 percent (p079) SOURCED.
Verdict: the best impact-for-effort item in Section 3, because it takes only rulemaking. 45 CFR Part 158 is a regulatory definition. Recommend the submission say plainly that this can be done without Congress, and pair it with: a list that names what is excluded — utilization management, prior authorization, claims review, network management, marketing, lobbying and untargeted provider bonuses; outcome evidence per activity before anything counts; and independent review of the classifications, as the RFI's second bullet proposes.
11.15 MLR modernisation: fee-based caps and disallowing internal markups (p079)
Proposed. Five concepts, of which two matter most: "Capping profits and administrative spending using a fee-based metric tied to a growth rate rather than as a percentage of total spend"; and "Disallowing internal price markups from MLR calculations, and capping or benchmarking related party transactions to prices paid to unaffiliated entities for the same services" (p079). Also: a flat percentage-of-revenue profit cap, escalating penalties including loss of subsidy eligibility, and extending MLR to self-insured plans.
Axis 1: STRONGLY POSITIVE for both. These are ranks 1 and 2 of Section 7.1.
Axis 2: INDETERMINATE for fee-based caps; UNCHANGED for markup disallowance. Neither touches access directly. This is where the two axes come apart cleanly: the two most valuable Axis 1 remedies in the document do nothing for Axis 2 at all. They are necessary and they are not sufficient, and the submission should say that instead of overselling them.
Axis 3: LOW for both, and that is what sets them apart. Fee-based caps kill the incentive to gross up spending instead of regulating around it — the RFI names that incentive exactly at p077: "limiting profits based on a percentage of revenue and spending may have the effect of increasing incentives for insurance companies to raise their own costs." A fee per member cannot be inflated by inflating spend. Markup disallowance is low-gameability because the comparator is the same service rather than an aggregate. Residual vectors are the three named in Section 6.5: service definition (bundle the affiliate service so no unaffiliated analogue exists — one contracting cycle), function relocation (charge the provider or plan sponsor instead of the insurer), and non-price terms (move volume rather than price).
GOOD. Well supported. The RFI gives the whole diagnosis at p077: MLR "applies only to the insurance entity rather than the parent company," the conglomerate "is both a buyer through its insurance subsidiary, and a seller through its provider subsidiary, enabling profit shifting through strategic transfer pricing." The scale is at p075: intercompany eliminations are roughly one third of UnitedHealth Group's 2025 revenue. The premium is at p073, footnote 319: 17 percent above outside practices. The comparator is at p079: traditional Medicare's implied MLR above 97 percent, against a commercial floor of 80 to 85 percent. Between 80 and 97 percent sits about 17 points of every premium dollar. That is what is on the table.
BAD. Only how it is presented. Two of the most valuable structural remedies available anywhere in American health insurance regulation turn up as the first and third of five bullets under "Senate Democrats invite comments on approaches to modernize and strengthen MLR rules" (p079), in the last real subsection before the TPA discussion. Neither is flagged as something that must happen before the threshold increase proposed on the same page — which the RFI asks about in "detailed proposals" language even while introducing it with "We invite feedback on this approach" (p079). The measurement fix is invited as a bullet; the cap that depends on it is where the document asks for detail. That is the sequencing trap of Section 7.5, visible in the verbs.
OMITTED. The three ways round it listed above. Also missing: any transition plan. A fee-based cap changes insurer economics substantially and needs a phase-in; floating it as a bullet invites the answer that it cannot be done.
Our evidence. The Section 7.2 derivations (14.5 percent of affiliate volume; $36 billion to $90 billion from fee-based conversion); MedPAC's v28 experience as proof that a definitional change to a payment formula measurably reduces extraction; $1,000 per enrollee in overhead and profit against $200 per enrollee in rebates.
Verdict: ranks 1 and 2. Make these the submission's principal Section 3 recommendations. Recommend: (a) affiliate payments reported at, and MLR-creditable only up to, the median price paid to unaffiliated entities for the same service code in the same geography — an arithmetic rule, which per Section 10.2 is more litigation-durable than a discretionary standard; (b) where no unaffiliated comparator exists, the payment is presumptively non-creditable, which closes the service-definition vector; (c) fee-per-member-per-month caps on the sum of profit and administrative expense, indexed to a growth rate below medical trend, phased over five years; (d) state explicitly that threshold increases must not precede (a) through (c), and explain why.
11.16 TPA and ASO reform: fee structure, fiduciary duty, MLR extension (p081-082)
Proposed. Establish and clarify TPA fiduciary duties to plan sponsors and employees "to protect against profiteering and improper determinations of medical necessity" (p081); extend MLR rebate obligations to TPA and ASO contracts; limit TPA and ASO contracts to a defined per-member-per-month fee-based structure that "forecloses opportunities to generate revenue using tactics such as spread pricing"; require pass-through of rebates, discounts and shared-savings revenue (p082).
Axis 1: STRONGLY POSITIVE. Section 7.1 rank 6, ESTIMATED $5 billion to $12 billion a year.
Axis 2: UNCHANGED directly. The money goes back to the employer. Employees only benefit if the savings reach premiums and cost-sharing, and whether they do is an empirical question the RFI never asks. Another clean split between Axis 1 and Axis 2, and the submission should say so.
Axis 3: LOW if you convert the fee structure; HIGH if you only add transparency. The fee conversion is structural: a fixed per-member fee cannot be pumped up by pumping up claims. Transparency on its own is easy to beat, and the RFI documents exactly how — TPA contracts "frequently include non-disclosure and similar clauses that restrict data sharing and bar the use of independent auditors," and employers trying to look at their own data "are often obstructed by the TPAs they retain" (p081). A disclosure duty you can sign away is not a duty.
GOOD. Section 3.IV is the best-matched part of the RFI, as Section 5.4 notes: it diagnoses middlemen creating their own demand — they profit from "complexities across claims and billing processes, many of which are likely created by their health plan affiliates" (p080) — and prescribes a fix at the same level. The evidence is unusually strong: ASO profits nearly five times fully-insured profits (p080); ASO fees running from $165 to $345 per enrollee between the quartiles (p082), a 2.09-fold spread for a service whose cost to deliver cannot plausibly double; and the repricer mechanism at p083, the sharpest single description of extraction in the document.
The repricer passage deserves separate emphasis because it establishes something the RFI never connects: "Repricers often work with or are affiliated with TPAs that have an incentive to artificially increase prices in order to inflate the size of the savings their repricers are able to generate, including by keeping certain providers out of network so they can charge higher rates" (p083). This is network construction as a profit instrument. Narrow networks are not a cost-control byproduct; they are an input to a fee-generating machine. The RFI documents ghost networks at p048 and repricer economics at p083 and never links them. Gap G5, and it is a first-order finding: the ghost network may not be an administrative failure at all.
BAD. The fiduciary-duty proposal on its own inherits ERISA's weak remedies, which the RFI itself notes at p065. And the text offers MLR extension and fee-structure conversion as either/or when they should be both.
OMITTED. An audit right in statute that cannot be signed away — gap M4, and the thing that defeats it is documented on the facing page. Also missing: any protection for employees as opposed to employers, so the savings are assumed to reach workers rather than required to.
Our evidence. ASO five-fold profit multiple and fee spread (p080, p082) SOURCED; the p062 natural experiment showing the same insurer denying differently by regulatory regime; the Kansas v. Aetna cross-plan-offsetting complaint (p082), at the allegation stage only; the Abraham, Cook and Sirmans Health Affairs work on ASO prevalence and profits, cited by the RFI at p062 fn 261.
Verdict: the best-designed section in the RFI. Back it and add three things. Recommend: (a) a statutory audit right for plan sponsors and the independent auditors they choose, which no contract term can waive — the most important single addition, and the RFI supplies its own justification for it; (b) fee-structure conversion and MLR extension, not one or the other; (c) a requirement that savings pass through to employees, not just to employers. And ask the Committee to join p048 to p083 — ghost networks and repricer economics are the same thing — which moves network adequacy out of consumer protection and into Section 3 corporate conduct, where the enforcement tools are stronger.
11.17 Buyback and executive-compensation limits (p072)
Proposed. Limit executive compensation; tax or restrict stock buybacks; limit investment of taxpayer funds "to domestic health care activities that provide a demonstrated public benefit" (p072). Footnote 313 identifies the precedents: conditions on taxpayer funding to banks under the Emergency Economic Stabilization Act of 2008 and to airlines under the CARES Act of 2020.
Axis 1: MARGINAL, and we should say so plainly. Telling an insurer what to do with profit it has already kept does not turn that profit into care. Ban buybacks and the money stays in the company as dividends, cash or acquisitions. The care-dollar ratio depends on how much of the premium reaches care, not on what the company does with the part it keeps.
Axis 2: UNCHANGED. Nothing connects a buyback restriction to whether a patient can get or afford care.
Axis 3: HIGH. The ways round it are all ordinary corporate finance: pay dividends instead of buying back stock; move pay into deferred, performance-unit or non-cash forms; run the buyback at the parent, where a rule aimed at the insurance entity cannot reach — the Section 6.5 perimeter problem again; redescribe "non-health care investment" as health-adjacent. Time to production: one quarter. Executive-pay caps have a long, well-documented history of raising total pay by changing its shape, and that is a predictable failure, not a surprise.
GOOD. The precedents at footnote 313 are genuinely useful: there is enacted precedent for putting strings on what companies could do with capital in exchange for federal support. The figures ($54 billion profit, nearly $150 million in collective CEO compensation, Cigna's $5 billion in buybacks and dividends against a $51 million compensation package, CVS's $3 billion and $23 million) establish the subsidy-conditionality argument at p016 and p071: taxpayer support exceeding $500 billion annually justifies conditions.
BAD. This is the clearest case in the document of a headline standing in for a mechanism. It leads Section 3, under a heading about making federal dollars serve enrollees rather than corporate profits, and it is the weakest Axis 1 item in that whole section. Affiliate benchmarking — which does move money to care — sits seven pages later as a bullet. The document's ordering therefore does not track its own Axis 1 magnitudes.
OMITTED. Any link between the restriction and care spending. The tools that do that job are the care-dollar-ratio floor and the fee-based cap, which govern how the premium is split rather than what happens to the leftovers.
Our evidence. $54 billion profit (p070) SOURCED; nearly $150 million CEO compensation (p072) SOURCED; $1,000 per enrollee overhead and profit against $200 per enrollee rebates (p071, p077) SOURCED. Note that our own Vol 2 buyback data runs 2007 to 2022 and requires updating before external use.
Verdict: a defensible condition on public money, and not an instrument for moving the care-dollar ratio. Recommend the submission state plainly that buyback and pay limits are fair conditions on public money and are not tools for moving the care-dollar ratio, and that on Axis 1 they sit behind the p079 items rather than in front of them. The stronger version is a condition rather than a ban: make eligibility for federal subsidies or federal markets depend on hitting a care-dollar ratio — the RFI's own penalty idea from p079, applied to Section 3.I. That turns an easily gamed restriction into an enforcement lever for the remedies that do work.
11.18 System-wide transparency and all-payer claims databases (p085-086)
Proposed. Interagency collaboration, evaluation capacity, and enforcement action against complex vertically integrated entities; data collection "consistently across private markets," "centralized, standardized and publicly available," "including through all-payer claims databases or similar clearinghouses" (p085-086).
Axis 1: NEUTRAL directly; foundational as an enabler for ranks 1 through 7 of Section 7.1.
Axis 2: UNCHANGED.
Axis 3: HIGH as written. The ways round it: claim it is all proprietary, which the RFI itself names as what defeats disclosure today at p074; pick your own reporting categories, already proven by "other" being the most common denial reason (p055); aggregate the numbers until transfer pricing disappears; and, decisively, ERISA preemption for self-insured plans.
GOOD. The RFI's framing is correct and admirably candid. It concedes twice that transparency alone is insufficient (p076, p085), it identifies the interagency effort begun in 2024 as having produced "no meaningful progress" (p085), and it names the capacity problem specifically: DOL "lacks the resources and expertise to review and act on" data it might receive (p085). It also implicitly adopts ungameability as a design goal — transparency "may act as a deterrent while providing data and information that allows policymakers to effectively limit new forms of gaming in the future" (p085).
BAD. About a third of the specification is there, per Section 6.3: of the seven things a reporting rule needs — reporting entity, unit of observation, granularity, frequency, audit, availability, penalty — at most two are specified. Two of the gaps are fatal.
First, delay. Nothing here records elapsed time (Section 6.4). A payer working against this reporting regime switches from denying to stalling and files a better report.
Second, Gobeille. Gobeille v. Liberty Mutual Insurance Co., 577 U.S. 312 (2016), holds that ERISA preempts state all-payer-claims-database reporting mandates as applied to self-insured plans. The case appears nowhere in the RFI — verified across all 86 pages. The document proposes APCDs as its transparency infrastructure and proposes extending requirements into the self-insured market, where over 60 percent of the insured are (p062), and never mentions the holding that shuts the state route down. This is not a difference of opinion about policy. It is a legal gap the whole proposal rests on, and drafting the requirement federally fixes it.
OMITTED. Delay measurement; Gobeille and the federal-versus-state drafting question; a transaction-level research file; and a presumption of invalidity where required data is not produced — the provision that would make the whole architecture self-enforcing.
Our evidence. The Exhibit 3 register, where only one of eleven remedies that everything else rests on has even partial data available; the RFI's own admissions at p074, p077, p085.
Verdict: right about what it wants, a third of the way to saying how, with one legal hole. Recommend the submission hand over the full specification from Section 6.3 and lead with the three most valuable additions: timestamps on every single authorisation and claim event; an audit right in statute that no contract can waive; and a rule that a determination is presumed invalid when the plan will not produce the data needed to check it. Cite Gobeille by name and recommend drafting the requirement federally (Section 10.3).
12. What a plan with real, measurable, enforceable impact requires
Answer first: nine components, one metric, and a date on which the plan can be declared a failure. Every component below is already established somewhere in this report — this section assembles them into a plan and then does the thing the RFI does not do, which is state how anyone would know whether it worked. The ordering is not stylistic. Measurement comes before caps, perimeter comes before rates, and the hospital price base has to be inside the boundary or the rest of it reroutes rather than reduces. A plan without a published baseline, a named auditor, a penalty and a falsification date is a press release with a bibliography.
This section does not re-rank Section 7. Section 7 ranks levers by dollars redirected per unit of instrument burden, and that ranking stands unchanged: affiliate benchmarking first, barring utilization management from quality-improvement classification second, fee-per-member caps third, with volumetric liability for wrongful denials as the largest absent item inside the insurance perimeter and a provider-side price instrument (M0) as the largest absent item anywhere. What this section adds is the scaffolding those levers need before they can be enforced at all, and the measurement regime that makes any of it checkable. Where a component here is not in Section 7's ranking, it is because it is infrastructure rather than a lever — it moves no dollars by itself and every lever that does move dollars depends on it.
12.1 Perimeter completeness: regulate the group, not the subsidiary
Mechanism. Every entity that touches the premium dollar sits inside the regulated boundary: the licensed insurance entity, the parent, every affiliate transacting with the insurance entity or the plan sponsor, third-party administrators, ASO arms, pharmacy benefit managers, provider subsidiaries, care-management businesses, analytics vendors and repricers. Identification by legal entity and tax identification number, not by trade name.
Why partial perimeters fail, and the RFI supplies the proof. MLR "applies only to the insurance entity rather than the parent company, which has created unintended incentives for insurers to expand into provider, PBM, and pharmacy markets to maximize profits and avoid rebate obligations" (p077) SOURCED. That is a Congressional committee stating in its own document that the last margin rule built the conglomerates. One move — paying an affiliate above market for a service — simultaneously defeats an MLR floor (larger numerator), rate review (higher justified medical trend) and a profit cap (profit booked outside the capped entity), because all three instruments are keyed to the same legal entity. UnitedHealth is reported to pay its own physician groups 17 percent more than outside ones (p073, fn 319) SOURCED, and intercompany eliminations ran at approximately one third of UnitedHealth Group's total revenue in 2025 (p075) SOURCED. A perimeter that stops at the insurance subsidiary is a perimeter drawn around one third less than the money.
Magnitude. Benchmarking an affiliate payment carrying a 17 percent premium down to the unaffiliated rate recovers 17/117 = 14.5 percent of that payment; applied to affiliate volume equal to one third of revenue, that is about 4.8 percent of total revenue at the most integrated conglomerate. ESTIMATED, derivation in Section 7.2. This is the highest-dollar single lever in the report and it is unavailable without the perimeter.
How it is enforced. Three provisions, drafted concretely enough to score: (1) the care-dollar ratio computed and filed at consolidated-group level, with revenue from every affiliate serving the insured population in the denominator; (2) affiliate transactions priced at documented arm's length against the same service sold to unaffiliated buyers, documented contemporaneously and inspectable without a waiver; (3) affiliate transactions treated as related-party transactions subject to disclosure, with a presumption of invalidity where the required documentation is not produced. Point three is what makes the other two self-enforcing, because it moves the cost of non-production onto the party holding the documents.
And this invents nothing. These groups are already supervised at holding-company level for solvency, and already held to an arm's-length standard for tax under Senate Finance's own jurisdiction, with a mature body of law behind it. ANALYST: they are supervised as a group when the question is whether they might go bust, and one entity at a time only when the question is whether premium dollars reach care. That asymmetry is the most persuasive framing available and it requires no new regulatory theory.
12.2 Chain completeness: the unregulated link is where the squeeze lands
Mechanism. Follow the dollar from entry to exit and regulate every link, or the lit segments push the money into the dark ones. Section 4B.5's chain table finds one link LIT, one PROPOSED, and five DARK — self-insured employer to TPA, TPA to provider, group-level intercompany flows, provider-side pricing, and patient-borne administrative cost.
Why this is a requirement and not a refinement. Two of the RFI's own best proposals leak along the chain, and one of them leaks in the direction of the patient. The fee-per-member cap at p079 is the document's largest single insurer lever, worth an ESTIMATED $40 billion to $90 billion annually, and per Section 4B.2 Route 3 it removes the insurer's financial reason to resist provider price increases — because once the insurer's income no longer scales with total spend, medical trend becomes somebody else's problem and passes to premium. Fix the insurer's incentives correctly and you delete the only private party with a commercial motive to fight the hospital price. Separately, MLR does not apply to self-insured plans, and over 60 percent of employer-covered people are in them (p062) SOURCED28: our derivation puts the RFI's central instrument at 37 to 46 percent of commercial covered lives (ESTIMATED, Section 4B.5). The main lever misses most of the market.
How it is enforced. Extend MLR-equivalent obligations to self-insured plans and TPA/ASO contracts — but after the instrument is repaired, not before, because extending a gameable metric into a larger market produces a larger gaming surface. Draft the reporting requirement federally: Gobeille v. Liberty Mutual Insurance Co., 577 U.S. 312 (2016) holds that ERISA preempts state all-payer-claims-database mandates as applied to self-insured plans, the RFI proposes APCDs as its transparency infrastructure, and the case appears nowhere in all 86 pages — verified. A statutory audit right that no contract can waive is the companion provision, because TPA contracts currently "bar the use of independent auditors" (p081) SOURCED.
The return leg is a link, and it is the darkest one. A chain traced only in the direction of payment misses every dollar that travels back. Manufacturer rebates, formulary placement and administrative fees, GPO administrative fees, distributor chargebacks, volume and purchasing discounts, 340B spread capture, and data or service fees charged back to the parties being paid — all of these move value in the opposite direction to the claim, and none of them appear in a chain drawn from premium to provider. The RFI concedes the mechanism and confines it to one sector: "pass-through of rebates and shared savings" for TPA and ASO arrangements (p080-p084) is an admission that rebates are currently retained rather than passed through, but it is framed as a pharmacy-benefit plumbing question rather than as a general rule about consideration flowing back to a payer.
The consequence for chain completeness is structural. A regulated forward link and an unregulated return leg is not a partly-lit chain — it is a complete bypass, because the return leg can carry any margin the forward link is prohibited from retaining, under a label chosen by the party being regulated. Section 2.1 therefore requires all retrospective consideration to be reported and netted from the care-dollar numerator regardless of receiving entity or nomenclature, and the chain analysis needs the same rule: every link is traced in both directions, and any payment travelling back is disclosed with its counterparty, its basis and its amount. Anti-kickback law already establishes that retrospective consideration in health care is a recognised hazard requiring disclosure; the gap is that its safe harbours were written for referral relationships rather than for consolidated-group accounting, so conduct that would be unlawful between unrelated parties is unexamined inside a single corporate group.
And the hospital has to be inside the chain. That is 12.5, and it is the component the RFI cannot supply by construction.
12.3 Transparency as precondition: disclosure first, caps second
Mechanism. A cap requires a measured number. Measure the number only at the regulated entity while the flow continues outside it, and the company satisfies the cap by moving the flow while the regulator records compliance. Worse, the cap tells the company precisely which number to manage. So the sequence is not a preference. It is mechanical.
The RFI has the sequence backwards, in its own verbs. It asks for "detailed proposals for specific adjustments" on raising MLR thresholds (p079) — a cap its own p077 has already shown can be moved by transfer pricing — while routine audit authority and line-item affiliate disclosure, the provisions that would make any threshold measurable, get "Senate Democrats invite feedback on proposals that would strengthen MLR reporting" (p077). SOURCED. Exhibit 3 states the consequence: of eleven remedies the document leans on, one has even partial data available today. The rest cannot be enforced, because the data required to enforce them does not exist.
What specifically must be disclosed. Five items, and the specification matters more than the principle:
- Line-item MLR with affiliate versus non-affiliate payments separated, per legal entity, per service code, per site of service, per geography — with the unaffiliated benchmark price for the same service on the same line. The RFI's own strongest instance, "line-item disclosures for payments to affiliate versus non-affiliate providers, QIA spending, and administrative overhead" (p077) SOURCED, stops one column short: it separates affiliate from non-affiliate without requiring the comparator that makes the separation actionable.
- Intercompany transfer pricing at transaction level — counterparty, service, unit price, volume, date. Aggregate reporting is not a weaker version of this; it is a different thing, because aggregation is where transfer pricing disappears. The RFI concedes the gap: "Financial flows within insurance conglomerates often remain opaque even when ownership is disclosed" (p074) SOURCED.
- Quality-improvement-activity reclassification, itemised by activity with effectiveness evidence attached. The RFI reports that current classifications are vague and have absorbed "untargeted provider bonuses, general marketing, overhead and lobbying" (p078) SOURCED. Itemisation is what turns 12.7's bright-line prohibition into an auditable one.
- Denial and overturn rates by product, by market segment, by service category, by stated reason, and by adjudicating system — the last of those being the one nobody currently asks for. If an algorithm made the determination, the algorithm is named and its denial and overturn rates are reported separately from the human ones. "Other" being the most common denial reason in 2024 (p055) SOURCED is the measured evidence that self-selected categories do not survive contact with a motivated filer.
- Timestamps on every authorisation and claim event — request, determination, appeal, payment. This is Exhibit 3's only entry marked NOT PROPOSED ANYWHERE, and Section 6.4 explains why it is the largest measurement hole: a payer working against a denial-rate metric switches from denying to stalling and files a better report.
How it is enforced. Statutory, non-waivable by contract, with a right of access for plan sponsors, a public audit summary, a de-identified transaction-level research file so findings can be replicated outside the agency, and a presumption of invalidity for any determination where the plan will not produce the data needed to check it. That last provision is the single most important addition in this report, because it converts disclosure from an obligation the plan resists into a defence the plan wants.
12.4 The capture constraint, not the disposition constraint
Mechanism. The care-dollar ratio is determined at the moment the company retains the dollar. What it does with the dollar afterwards — buyback, dividend, acquisition, reserve, data centre — changes neither the numerator nor the denominator. So an instrument aimed at disposition cannot move the metric, however large the sums it governs.
This is the report's clearest disagreement with the RFI's own headline. Stock buybacks and executive compensation lead Section 3 of the RFI, under a heading about making federal dollars serve enrollees, and p072 proposes genuine restrictions rather than disclosure — which deserves credit, and footnote 313's precedents (conditions on banks under the Emergency Economic Stabilization Act of 2008, on airlines under the CARES Act of 2020) show the instrument has been enacted before. But on Axis 1 this is the weakest substantive item in Section 3, and affiliate benchmarking — which does move money to care — sits seven pages later as a bullet.
And a payout cap without a capture constraint is worse than neutral. If retained profit cannot be returned to shareholders, the highest-return remaining use of the cash is buying things: providers, PBMs, care-management businesses, analytics subsidiaries. That is precisely the vertical integration the RFI diagnoses at p074-p076. ANALYST, and this is the sharpest form of the objection: a buyback restriction with no capture constraint pays insurers to acquire the very affiliates that transfer pricing runs through. The cure funds the disease.
How it is enforced — turn the ban into a condition. Make eligibility for federal subsidies and participation in federal markets contingent on meeting a consolidated-group care-dollar-ratio floor. That borrows the RFI's own penalty language from p079 — "escalating penalties... including increased civil monetary penalties, or the inability to receive federal subsidies or participate in certain markets" — aims it at capture instead of payout, and converts the most gameable item in Section 3 into the enforcement arm for the least gameable ones. It also grounds itself in the RFI's own subsidy-conditionality argument: taxpayer support projected to exceed $500 billion annually (p071) SOURCED justifies conditions on the recipients.
12.5 The hospital price base: the component the RFI cannot contain
Mechanism. Insurer-conduct rules govern how the dollars are contested. The hospital price decides how many dollars there are to contest. A plan that regulates the first and not the second changes the distribution of a total it has not touched.
Magnitudes, all SOURCED and all carried from the external structured review of 30 July 2026 (Thomas Ferguson, independent of Brainworks; full attribution at 4A.4c), which states it verified them against public CMS, KFF, RAND, GAO and HHS sources. We have not re-derived them, and any submission using them should say so. Hospital care is about $1.6 trillion, roughly 31 percent of national health spending (2024); hospitals drove about 40 percent of all national spending growth from 2022 to 2024, roughly $277 billion; hospital services are about 42 percent of privately-insured spending (2022); commercial plans pay 254 percent of Medicare inpatient and 279 percent of Medicare outpatient rates (2022 data); mergers in already-concentrated markets raise prices 6 to 65 percent; physician-service prices rise 14.1 percent after hospital acquisition, nearly half of it from the exploitation of payment rules; and at least 47 percent of physicians were employed by or affiliated with hospital systems in 2024, up from under 30 percent in 2012. Against that, the RFI's entire hospital financial content is one number — the $18 billion hospitals spend on avoidable work to overturn improper denials (p060) SOURCED36 — and it measures hospitals as victims.
Four instruments, all inside Senate Finance's jurisdiction, which disposes of the jurisdiction objection.
- Benchmark pricing tied to a Medicare multiple. The RFI already contains the working example and never generalises it: Washington's Cascade Select caps payment "at 160 percent of Medicare, with the legislature able to make additional downward adjustments to payment rates," and "Hospitals are required to contract with at least one Cascade Select plan" (p031) SOURCED. A must-offer obligation on the provider paired with a rate ceiling is the only structure in 86 pages that constrains a hospital price, and it appears once, as a state case study. Generalised to designated concentrated markets it is the single largest available lever anywhere in this analysis. Difficulty: HIGH to VERY HIGH. Say so.
- Site-neutral payment for services delivered in hospital outpatient departments. "Facility fee" and "site of service" appear zero times in the RFI; Exhibit 6 sizes facility-fee and site-of-service arbitrage at $95 billion ANALYST — an all-payer differential of our own construction, and the scope difference between it and the Medicare-only, low-complexity, budget-neutral published site-neutral estimates is set out at 4A.5c. The mechanism itself is anchored: RAND finds common outpatient services in ambulatory surgery centres averaged 171 percent of Medicare prices but would have averaged about 107 percent at hospital-outpatient-department rates SOURCED18, and the acquisition evidence above attributes roughly half of the post-acquisition price rise to the exploitation of payment rules. The magnitude is the weakest part of this item and the mechanism is the strongest; the instrument does not depend on the magnitude.
- Enforcement of Internal Revenue Code §501(r) community-benefit standards against charity care actually delivered. "Nonprofit," "tax-exempt," "charity care" and "community benefit" appear zero times in the RFI, verified. Exhibit 6 carries nonprofit surplus at $65 billion ESTIMATED. This is a tax-administration question, which is to say it is Finance's, and it needs no new authority — only enforcement of a standard already in the code.
- Consolidation review with a price test. "Market power," "monopoly" and "antitrust" appear zero times; of the four occurrences of "consolidation," two are explicitly insurer-scoped, one names insurers as the acquiring party, and one is unqualified market-level — none is provider-scoped (4A.3). The document's only reference to provider mergers is a data-collection bullet at p075. A merger review that asks what happened to prices in the acquirer's existing markets is the cheapest available version of this, and it is the one the 6-to-65-percent evidence directly supports.
A note on the benchmark, because this instrument depends on it. Every item above uses Medicare rates as the reference point, and Medicare pays the average hospital below average cost — MedPAC puts the aggregate fee-for-service Medicare margin at –13.0 percent in FY 2023, with the median among relatively-efficient hospitals at –2 percent SOURCED. The design implication is that a rate ceiling should be calibrated to the efficient-hospital cost level rather than to the aggregate, which is what Washington's 160-percent multiple in effect does, and it is why the carve-outs at 4A.3a are part of the instrument rather than a concession attached to it. The full treatment of the benchmark objection is at 4A.5d.
And ask the price-base question of every remedy, including the ones this report favours. The RFI's single-payer administrative saving of "over $500 billion annually" (p038) SOURCED states no assumption about hospital prices. A single payer that inherits a 254-percent-of-Medicare price base banks the paperwork saving and leaves the base intact. That is not an argument against single payer. It is an argument that the price base is a separate question that no financing architecture answers by itself.
12.6 Algorithmic accountability on both sides of the claim
Mechanism. A system performing the function of a human prior-authorization reviewer, coder, biller or appeals writer inherits that function's documentation, clinical-criteria and record-production obligations. This is not a new regulatory category; it extends existing requirements to a new actor performing an existing function, which is why CMS can pursue much of it through rulemaking rather than statute.
Why symmetry is the whole point. The RFI sets credential requirements for human reviewers (p052) and says nothing about the systems doing most of the work: "artificial intelligence" appears seven times, "algorithm" zero times, and "machine learning" once — in a footnote citing the National Association of Insurance Commissioners' own 2025 survey of insurer AI use (p063, fn 266). The document holds the pointer to the regulatory inventory of payer AI and asks nothing about it. Meanwhile it concedes the other half in two words and walks away: "health insurers and providers are increasingly incorporating artificial intelligence into their systems" (p053) SOURCED, with footnotes 221 and 222 citing the arms-race literature directly. The provider side is real and quantified: $14.6 billion in EHR-era excess hospital payments and $2.3 billion in AI-enabled coding excess, both SOURCED, both carrying the scope cautions stated in full in Section 8.6a and not to be used as national totals.
Magnitude, stated honestly. An arms race between hospital revenue-cycle AI and insurer denial AI moves no dollars to care — that is the finding. Both sides' spending is individually rational and the sum is waste, and premiums and cost-sharing pay for all of it. So the magnitude claim here is not dollars redirected but dollars prevented from being burned: the $18 billion of hospital denial-rework (p060) SOURCED46 and the payer-side prior-authorization processing cost are the two visible halves of the same fight, and automating both raises volume while unit cost falls, which is why the total rises rather than falls.
How it is enforced. Four provisions. (1) Register every automated system used to make or recommend a coverage determination, a code assignment or an appeal, with its version history. (2) Report denial, approval and overturn rates by system, separately from human determinations — the reporting element in 12.3, item 4. (3) Apply the same documentation and clinical-criteria standard to the automated determiner as to a human, so that a credentialed signatory ratifying machine output at volume does not satisfy the requirement. Exhibit 2 rates reviewer-qualification rules WEAK precisely because that ratification route is open. (4) Symmetric application to provider-side coding and appeal-generation systems. Automate the function, inherit the function's obligations — on both sides of the claim. Section 8.6a assesses it Axis 1 POSITIVE in both directions, Axis 2 IMPROVES, Axis 3 LOW, and it is the only remedy in this report that cuts extraction at both ends of the same transaction. Neither the RFI nor Brailer proposes it.
12.6.1 Algorithmic capacity for regulators and patients, funded by the penalties
The asymmetry that makes every other remedy in this report fail slowly. Sections 8 and 12.6 establish that coverage determination is being automated at scale on both sides of the claim. Nothing in the RFI, and nothing in current law, automates the third party — the regulator who is supposed to supervise it or the patient who is supposed to contest it. Oversight and appeal remain entirely people-powered while the conduct being overseen runs at machine speed and machine volume. That is not a staffing shortfall to be closed with a larger appropriation. It is a structural mismatch, and it gets worse every year automation improves, because the cost of generating an adverse determination falls while the cost of contesting one does not.
The arithmetic is already decisive, and it is in the RFI's own numbers. Eighty-five million in-network claims denied, a 19 percent denial rate, and an appeal rate of 0.2 percent (p055, p057) SOURCED. Those three figures describe a system in which 996 of every 1,000 denials are never contested at all. The RFI reads the appeal rate as evidence that patients do not know their rights. That is part of it. The larger part is that contesting a denial costs the patient hours they do not have against a system for which issuing the denial cost very close to nothing — and the ratio of those two costs is now moving apart rapidly. A patient-side process that requires a human to write a letter cannot supervise a payer-side process that requires no human at all. The same asymmetry applies to the regulator: 85 million denials cannot be audited by a caseworker reading files, and a regulator restricted to complaint-driven review will only ever see the 0.2 percent that complained — the least representative sample available, selected for patient persistence rather than for severity of error.
Proposal: fund third-party algorithmic systems for patient advocacy and regulatory supervision, financed by penalties collected from automated-determination violations. Five design requirements, each written to resist the obvious failure modes:
- Independence from both payers and providers. Funded through a public trust or dedicated fund, not by the regulated entities directly, and not operated by them. A payer-funded advocacy tool is a customer-service department with a better name.
- Financed by violation penalties, on a deliberately self-limiting basis. The volumetric liability in Exhibit 9, metric 3 — a payment obligation proportional to denials overturned on review — is the natural funding source, because it scales with exactly the conduct the capacity is needed to police. It has the correct property that a compliant industry starves the fund, and an extractive one funds it generously. It also has the obvious hazard: an enforcement body dependent on penalty revenue has an interest in violations continuing. Cap the fund, direct the surplus elsewhere, and put the appropriation on a floor so the capacity does not collapse in the year compliance improves.
- Patient-side automation of appeal, not merely of information. The binding constraint is not that patients lack a website explaining their rights; it is that assembling records, citing plan language and clinical criteria, and drafting an appeal takes hours. A system that does that work on the patient's behalf converts the 0.2 percent appeal rate into something that disciplines the denial decision itself. This is the single highest-leverage intervention in this subsection, because Section 12.11's metric 3 makes overturn rate the enforcement trigger, and an overturn rate computed over a 0.2 percent sample is not a measurement of anything.
- Regulator-side population auditing rather than case review. Statutory access to the full determination record — every denial, its stated reason, the system that issued it, and its outcome — audited continuously across the whole population instead of sampled by complaint. This is the supervisory analogue of what payers already do to claims, and it is what makes metrics 3 and 4 of Exhibit 9 auditable rather than aspirational.
- The advocacy and audit systems are themselves subject to 12.6. Registered, versioned, performance-reported, and held to the same documentation standard. A patient-advocacy system that hallucinates a clinical citation harms the patient it represents, and an oversight tool exempt from the oversight rules is a rule with an exception large enough to drive the whole problem through.
Axis ratings. Axis 1 POSITIVE, indirectly but materially — it does not itself move a dollar to care, but it is what makes the care-dollar ratio's enforcement machinery operable at the volume the system actually runs at; without it, metrics 3 and 4 are unenforceable at scale and the caps they support decay into paperwork. Axis 2 IMPROVES — it attacks effective access directly, at the exact point where nominal coverage fails to become received care. Axis 3 LOW to MEDIUM: the conduct is hard to game because the audit runs on the population rather than on a sample, but the funding mechanism is gameable in the direction described in requirement 2, and a hostile administration could simply decline to build the capacity — which is why the appropriation floor matters more than the penalty ceiling.
Stated as a caution, because this report holds itself to it. We are proposing algorithmic systems as a remedy for algorithmic harm, and the symmetry is not automatic. Requirement 5 is what keeps this from being an arms race with a public-sector entrant: the point is not that the regulator should out-compute the payer, but that supervision and appeal must run at the same scale as the conduct they supervise. Nothing in this subsection is sized in dollars — no published measurement of automated-advocacy yield exists, and we will not manufacture one. ANALYST throughout.
12.7 Simplicity as enforcement infrastructure
Mechanism. Complex rules are gameable rules. Every definition is a gaming surface, every carve-out is an exit, and every case-by-case determination is a transaction the payer can automate and the patient must contest. The design preferences, in order: bright line over standard, categorical over case-by-case, structural over procedural, aggregate over transactional.
And automation is why this got worse rather than staying the same. A complex rule's only protection was ever the labour cost of working around it — somebody had to read the file, draft the letter, make the call. Automation removes that cost. A 19 percent denial rate on 85 million claims with "other" as the most common stated reason (p055), against a 0.2 percent appeal rate (p057) SOURCED, is not a process failure; it is a process running as designed at a marginal cost approaching zero. This is the Brailer durability argument arrived at from the accounting side rather than the software side: gaming by software and gaming by accountant are the same problem, because both are optimisation against a stated target. A rule with a definitional boundary gives the accountant somewhere to move the cost and the model somewhere to move the decision. A flipped default, a flat prohibition, or a ratio computed across a whole book of business gives neither of them anywhere to go.
The check on this, and it holds. Exhibit 2 names five AI-durable remedies — presumptive approval of in-network care (p052), automatic external review (p058), independent adjudication (p056), approval on timeout (p053), and consequential liability for overturned denials (p065). Exhibit 7 can name no relocation destination for four items, and two of them are the same two. The lists came from different tests and the overlap is not luck: the same structural property puts a proposal on both. Presumptive approval is the cleanest case — it changes what happens when nothing happens, and there is no way to automate against inaction that helps the payer, and no way to book around a rule that bites on an outcome rather than a cost category.
How it is enforced. Prefer the drafting that needs no enforcement discretion. "Utilization management may not be classified as quality-improvement activity" is enforceable by inspection of a filing; "quality improvement activities must be reasonably related to improving health outcomes" is an invitation to negotiate. Where discretion is unavoidable, put the burden on the regulated party (12.3's presumption of invalidity) rather than on an agency that oversees nearly 3 million health plans and lost an estimated 20 to 25 percent of its workforce in 2025 (p063) SOURCED.
12.8 Chronic illness and effective access
Mechanism. Nominal access is coverage on paper. Effective access is a patient receiving indicated care, within the clinically relevant window, at a bearable cost, without spending resources they do not have. Every proposal in the RFI is built for a patient who enrols once a year, meets the system for one episode, might shop, pays a deductible, and either gets the care or does not. Continuous multi-system illness breaks that model at every point: there is no episode, nothing to shop for, cost-sharing cannot steer a decision nobody is making, one authorisation becomes a stream of them, and the deductible resets every January against a condition that does not.
The void is verified and total. Across 86 pages: long COVID 0, ME/CFS and myalgic encephalomyelitis 0, chronic illness 0, post-viral 0; "chronic" appears once, in an illustrative clause inside one of seven bulleted prior-authorization options (p051); "disability" appears once, retrospectively, about 1965 (p004). Of roughly 39 occurrences of "complex," two describe a patient and the rest describe the system. We disclose the same void in our own Volume 2 — no chronic-illness or disabling-illness cohort in twenty chapters — and we state that we found the gap and the mechanism rather than that we have filled it. We also looked for published denial or prior-authorization rates specific to long COVID, ME/CFS or other contested diagnoses and no such dataset appears to exist in published form, which is why Section 9.3 argues the mechanism without numbers instead of estimating around the hole.
Why this population is where extraction lands hardest. Continuous multi-specialty need means continuous exposure to exactly the channels the RFI does not touch — facility fees, site-of-service differentials, consolidated-system pricing. And Brailer's own conditions for AI to compound value are absent on the care side and present in full on the adjudication side: contested chronic illness has no large structured labelled dataset, no human-in-the-loop correction against agreed ground truth, and no fast unambiguous outcome signal, while revenue-cycle management has all three. For the sickest and hardest-to-diagnose patients, AI cannot improve their care and is very well suited to denying it. That is not a forecast; it follows from where the data and the outcome signals sit.
How it is enforced — three cheap, specific provisions. (1) Define "chronic condition" in statute for the p051 prior-authorization limitation, which currently names the category and supplies no way to identify a member of it. (2) Require denial and authorisation reporting broken out by condition category, so condition-specific denial rates can be measured for the first time. (3) Require reporting of authorisations per patient per year, which converts endless re-authorisation from an anecdote into a number and is the only proposed metric anywhere in this report that measures rationing by exhaustion.
12.9 Medicare Advantage overpayment, and why ownership-only diagnoses fail
Mechanism. Two mechanisms, not one, and MedPAC separates them. Coding intensity raises the payment the government makes for a beneficiary without raising the care that beneficiary receives — the same mechanism as provider-side coding intensity, run against a public payer. Favourable selection raises the payment without anyone recording anything at all: plans enrol beneficiaries who are cheaper than their risk scores predict, and the formula pays the score. SOURCED42.
Magnitude and why it settles an argument. $76 billion SOURCED42 is the largest single line in our extraction taxonomy (Exhibit 6, M16) — larger than any insurer-conduct channel in the RFI's perimeter — and it happens inside a public programme, run by a public payer, under public rules. The figure is MedPAC's total projected 2026 MA overpayment against traditional Medicare, not a pure upcoding line: MedPAC attributes roughly 11 percentage points to favourable selection and about 4 to coding intensity SOURCED42.
A reconciliation we owe the reader. An earlier iteration of this analysis carried $83 billion, or 22 percent, for Medicare Advantage overpayment. This report uses MedPAC's $76 billion and 14 percent, and treats the earlier internal figure as superseded. Two reasons. First, where a Congressional advisory commission publishes a figure within its own statutory remit, we defer to it rather than to our own reconstruction — the published number is the one the Committee's own analysts will hold, and a submission that quotes a higher in-house figure invites a dispute about our arithmetic instead of a discussion about the mechanism. Second, the reduction has an identifiable cause: the phase-in of the CMS v28 risk-adjustment model removed a number of diagnosis codes with weak clinical documentation from risk-score calculation, which compresses the coding-intensity component that the earlier figure sized on the prior model. The lower number is the better number, and it remains the largest single line in the taxonomy. State it that way and the argument gets stronger, not weaker — favourable selection is a mechanism with no owner to blame, produced by the risk-adjustment formula itself. "Upcoding" and "risk score" appear zero times in 86 pages, verified. ANALYST: if the biggest number in the taxonomy does not require a for-profit insurer to be the payer — and its larger component does not require misconduct by any payer at all — then extraction is a property of the payment structure and not of who owns the entity. That is the waterbed principle in its most general form, and it is why a plan built on corporate-greed framing will keep hitting the wrong target: regulate an owner type and the mechanism moves to another owner type, because the mechanism was never the ownership. The external review in 4A.4c reaches the same reading of the same figure by an unrelated route, treating public-programme overpayment as the decisive inconsistency against an insurer-conduct-only diagnosis.
How it is enforced. Risk-adjustment reform is Medicare policy and therefore Senate Finance's own: audit coding intensity against chart review at scale rather than by sample, apply the recovery to the contract rather than the extrapolated cohort, and — the structural version — pay a coding-intensity adjustment that is measured and applied prospectively rather than litigated retrospectively. This is also the cleanest available test of whether a plan is aimed at structure or at villains. A plan that regulates insurer buybacks and leaves $76 billion of public-programme overpayment untouched has chosen the smaller number for the better headline.
12.10 Network availability, price discrimination against independents, and outcome accountability
Three remedies that belong together because they are the same failure measured at three depths: whether care can be obtained, what it costs the entity that provides it, and whether patients are any healthier at the end. Each is absent from the RFI, and each is measurable.
12.10.1 Availability, not roster membership
Mechanism. Section 2.2 establishes that network adequacy measured as names on a list can be satisfied in full while delivering no care, because a directory entry stays true when a physician closes their panel or books eleven months out. The standard has to be realised availability.
How it is measured. Secret-shopper auditing, conducted by the regulator or its contractor, calling as an ordinary enrollee and recording what is actually offered: whether the number connects, whether the practice is contracted with that plan, whether it accepts new patients under it, and the date of the first available appointment for a stated presenting condition. This is not a novel instrument — it is how ghost networks were documented in the first place, including in the federal and state work the RFI relies on at p048. What is novel is making it the compliance standard rather than the exposure method. Reported as a distribution, never a mean: the 90th percentile wait is the number that describes the patient in trouble.
Clinically indexed windows. A single fixed interval is wrong in both directions — too slow for a suspected malignancy, needlessly strict for a routine review. Windows set by condition category in regulation, not chosen by the plan, consistent with the elapsed-time metric in Exhibit 9.
How it is enforced. Penalties tied to realised wait times and realised availability, not to roster counts. A provider who is not contracted, not accepting new patients, or not offering an appointment within the clinically indexed window does not count toward adequacy — which converts the whole question from a penalty schedule into a definitional one, and definitional fixes are much harder to game than thresholds. Where a plan cannot meet the standard, the consequence is the out-of-network default in 12.10.2 below, not merely a fine: a fine is a cost of doing business, whereas an obligation to pay out-of-network rates removes the saving that made network starvation profitable.
The qualification we are obliged to repeat. Section 4A.7 finds that adequacy floors in concentrated provider markets transfer money to must-have systems rather than improving access. That applies to an availability standard exactly as it does to a roster standard, and arguably more forcefully, since a stricter standard raises the price of the unexcludable provider further. The pairing 4A.7 requires — a rate ceiling or a must-offer obligation in designated concentrated markets — is a precondition here too. Stating this costs us the cleaner version of the recommendation, and omitting it would be the same failure we document in Section 4C.
Axis ratings. Axis 1 NEUTRAL to POSITIVE (it does not move the ratio directly; it prevents premium being retained against care never delivered). Axis 2 IMPROVES effective, which is the entire point, and is the rating the RFI's own roster-based proposal cannot earn. Axis 3 MEDIUM: harder to game than a directory rule, but a plan can still contract broadly and thinly, and secret-shopper audits can be gamed if the calling pattern is predictable.
12.10.2 Presumptive approval must extend out of network when in-network care is unobtainable
The gap this closes. Presumptive approval of in-network care — the remedy this report supports elsewhere and rates among the strongest in the RFI — contains a defect that Section 2.2's availability analysis exposes. An approval to receive care from a network that cannot supply it within the clinically relevant window is not care. Worse, it converts network starvation into a strictly profitable strategy: the plan concedes the authorisation, incurs no obligation, and the patient waits. Presumptive approval without an availability backstop increases the return to a thin network.
The provision. Where in-network care meeting the presumptive-approval standard is not obtainable within the clinically indexed window, the presumptive approval extends automatically to out-of-network care at in-network cost-sharing, with the plan liable for the balance. No separate patient application, no second-stage authorisation, and no requirement that the patient prove the network's inadequacy — the burden of demonstrating that timely in-network care was available sits with the plan, which is the party holding the appointment data.
Why the burden allocation is the whole provision. A version requiring the patient to document unavailability would be satisfied by the 0.2 percent of patients who already appeal (p057) and by nobody else. The remedy works only if it is automatic. This is the same design principle as the timeout approval in Exhibit 9 metric 4: the default on expiry favours the patient, and the party with the records carries the burden of rebutting it.
Axis 3: LOW, unusually. The gaming routes that defeat threshold rules do not work here, because the trigger is the plan's own failure and the remedy is automatic. The residual route is disputing what counts as the clinically relevant window, which is why those windows must be fixed in regulation by condition category rather than negotiated case by case.
12.10.3 Payment discrimination against independent practice, and internal most-favoured pricing
Mechanism, and why it belongs in a report about extraction rather than about antitrust. The same payer pays materially different rates for the identical service depending on who owns the practice. The RFI supplies one direction of this itself — UnitedHealth paying its own physician groups 17 percent more than unaffiliated ones (p073, fn 319) SOURCED. The mirror is the independent physician paid less than a conglomerate-owned or hospital-owned competitor for the same code, in the same market, on the same day. The differential is not a market outcome; it is the acquisition mechanism. Sustained long enough, it makes independent practice unviable, at which point the practice sells to the system paying itself more — and the acquisition then raises prices further, which is the M13a finding this report already sources at 14.1 percent post-acquisition price growth.
This matters for the care-dollar ratio specifically. The differential is simultaneously a cost to the payer (inflating the numerator, per Section 2.1) and a subsidy to the affiliate, so it raises reported care spending while reducing the care actually purchased per dollar. It is the clearest case in this report of a number improving while the thing it measures gets worse.
Related restraint: prohibitions on independent practice competing with payer- or system-owned services. Contracting terms that bar an independent physician from offering a service the contracting system also offers, or that condition network participation on not competing, convert a payment relationship into an exclusion instrument. So do internal most-favoured-nation arrangements under which a system's own facilities receive terms no independent competitor can obtain. The remedy is a flat prohibition on most-favoured internal pricing and on non-compete conditions in network participation agreements, with rate parity for identical services enforced through the affiliate-differential metric already specified in Exhibit 9, metric 2.
Measurement. Metric 2 requires reporting of mean price paid to affiliated versus unaffiliated providers by service code, site and geography. The independent-practice cut is a decomposition of that same filing — add ownership type (independent, system-owned, conglomerate-owned, PE-owned) as a reported dimension. No new reporting burden, one additional field, and it makes a currently invisible transfer countable.
Honest limit. We have one sourced data point on the affiliate-favouring direction and no systematic series in either direction. No published measurement of the national independent-versus-owned payment differential exists that we could retrieve. The mechanism is documented at one conglomerate in one service line; the generalisation is ANALYST. This is the same class of gap as M9 in our own taxonomy, and it should be stated as a measurement to be created rather than a finding to be cited.
12.10.4 Rate and regulate on outcomes, not only on process
The argument. Every metric in Exhibit 9 measures conduct — what was paid, what was denied, how long it took. Conduct metrics are gameable by construction, because the regulated party controls the categories. Health outcomes are not, or are much less so, because they are measured on patients rather than reported by plans. A plan can restructure its denial taxonomy; it cannot restructure the mortality, control and hospitalisation rates of the population it covers.
The provision. Aggregate outcome measurement for each covered population, risk-adjusted and benchmarked against national and regional rates for a comparable population: avoidable hospitalisation and readmission, control rates for the major chronic conditions, stage at diagnosis for the screenable cancers, maternal and infant outcomes, and all-cause mortality. Entities rated publicly on performance against benchmark, with penalties attaching to sustained underperformance not explained by case mix. A plan whose members are measurably sicker than comparable populations is not delivering the care it is being paid for, however clean its filings.
Why this is the natural enforcement partner for the access findings above. Restricted effective access should show up in outcomes, and this is where the accessibility harm in the gap register becomes falsifiable rather than rhetorical. If narrow networks, long waits and engineered friction do not worsen outcomes, that is evidence against our own thesis, and we should want to know it. We expect the opposite, and the mechanism is well established in the health-services literature: delayed diagnosis worsens stage at presentation, interrupted chronic-disease management worsens control, and both raise avoidable admissions.
Four hazards, stated because outcome regulation has failure modes and pretending otherwise would be the same sin we document elsewhere. (1) Risk selection. Rating on outcomes rewards avoiding sick people; this is the oldest failure in managed care and it is why risk adjustment has to be robust and audited, and why outcome rating must sit alongside the conduct metrics rather than replacing them. (2) Attribution over time. Outcomes reflect years of care and patients switch plans annually, so short-horizon attribution is unfair and long-horizon attribution is slow. Multi-year windows and attribution rules fixed in regulation. (3) Social determinants. Populations differ for reasons no plan controls; unadjusted league tables would penalise plans serving deprived areas, which is the opposite of the intent. (4) Upcoding as a defence. Risk adjustment is itself gameable — this report sources $22 billion in Medicare Advantage coding intensity (M16), which is exactly this manoeuvre already in progress. Outcome rating increases the return to it, so it must be paired with the coding-intensity controls in 12.9.
Axis ratings. Axis 1 NEUTRAL directly, POSITIVE indirectly. Axis 2 IMPROVES, and it is the only measure in this report that tests effective access on the patient rather than on the paperwork. Axis 3 MEDIUM: harder to game than conduct metrics, but the risk-selection and risk-adjustment routes are real, well documented, and already being used. All figures in this subsection that are not cross- referenced to a sourced metric elsewhere in this report are ANALYST.
12.11 Measurement and enforcement
This subsection is the point of the whole section. Everything above is arguable policy. What follows is the part that decides whether any of it can be shown to have worked, and it is the part the RFI does not have at all. A metric with no penalty is a press release. A metric with no baseline cannot be scored. A metric with no anti-gaming provision is a target the industry will hit while the thing it was supposed to measure gets worse.
Exhibit 9 — Headline metrics, baselines, targets, cadence and enforcement
Five metrics. Not fifty — a dashboard nobody can audit is the same as no dashboard. Each is defined tightly enough to be written into statute, and each carries the honest statement of what its baseline is today.
| # | Metric | Definition, statute-ready | Baseline today | Target | Cadence | Who reports / who audits | Penalty on failure |
|---|---|---|---|---|---|---|---|
| 1 | Consolidated-group care-dollar ratio (CDR) | Payments for delivered care, valued at arm's-length prices with affiliate differentials reclassified out of the numerator, divided by all dollars entering the system attributable to the covered population — premium, employer and employee contributions, federal subsidies and tax expenditures, cost-sharing, and fees collected from providers or plan sponsors by affiliated entities. Computed at consolidated parent, all affiliates included | None exists. No US filing produces this number. Nearest available anchors, both SOURCED: ~$1,000 per enrollee captured in overhead and profit (p071) and ~$200 per enrollee returned by MLR in 2024 (p077) | +5 percentage points within 5 years of enactment, measured against the first published baseline | Baseline year one; annual thereafter, audited | Consolidated parent reports; HHS/CMS audits with statutory access to affiliate books; public audit summary | Escalating civil monetary penalties, then loss of eligibility for federal subsidies and federal market participation — the RFI's own p079 penalty language, aimed at capture |
| 2 | Affiliate price differential | For each service code, site of service and geography: mean price paid to affiliated providers divided by mean price paid to unaffiliated providers for the same service | 17 percent premium reported at one conglomerate in physician services (p073, fn 319) SOURCED. No systematic series exists | ≤ 1.00 (parity) within 3 years | Quarterly filing, annual audit | Consolidated parent reports at transaction level; regulator audits against the de-identified research file | Differential above parity disallowed from the CDR numerator; documentation not produced ⇒ presumption of invalidity, whole transaction disallowed |
| 3 | Denial and overturn rate by product and by adjudicating system | Denials divided by claims and prior-authorization requests, and overturns divided by denials, broken out by product, market segment, service category, stated reason, and by the named automated system that made or recommended the determination | 19 percent of in-network claims denied, 85 million claims, "other" the most common stated reason (p055); appeal rate 0.2 percent (p057). SOURCED. No breakout by system exists anywhere | Overturn rate below 5 percent of denials — a high overturn rate is evidence the denials were wrong, not evidence appeals work | Quarterly, with the reason taxonomy fixed in regulation rather than chosen by the filer | Plan and TPA report; DOL/HHS audit; automated-system register published | Volumetric liability: a payment obligation proportional to the count of denials overturned on review, payable regardless of whether any patient complained |
| 4 | Elapsed-time distribution | Median and 90th-percentile days from request to determination, determination to appeal resolution, and service to payment — per authorisation and per claim, timestamped at every event, with clock resets recorded as separate events | None exists. Exhibit 3's only entry marked NOT PROPOSED ANYWHERE. The RFI names the clock-reset tactic (p053, p060) and proposes no measurement | 90th percentile within the clinically relevant window for the service class; no undisclosed resets | Monthly | Plan and TPA report; audited against provider-side submission records | Approval on timeout: expiry of the statutory clock pays the claim, with the clock un-resettable absent a recorded, auditable event |
| 5 | Authorisations per patient per year | Count of prior-authorization requests per enrolled patient per year, reported by condition category | None exists. No published dataset, and the RFI has no vocabulary for it | Published and falling; no target set in year one because there is no baseline — say so rather than invent one | Annual, by condition category | Plan reports; condition taxonomy set in regulation | Reporting failure treated as a substantive violation, not a filing lapse |
Three things to notice about that table. First, three of the five metrics have no baseline at all today. That is not a weakness in the plan; it is the finding. The first deliverable of any serious reform is the measurement, which is why 12.3 precedes every cap in this section. Second, metric 1 is the spine and the other four are its audit trail — metric 2 protects the numerator, metric 3 and metric 4 protect against the plan hitting the ratio by paying for less care faster, and metric 5 is the only proposed measure of rationing by exhaustion. Third, every penalty in the last column already exists somewhere in the RFI or in enacted law, which is the point: none of this requires a new enforcement theory.
Exhibit 10 — How each metric gets gamed, and what closes the route
This is where the report's own gameability analysis has to pay for itself. For every metric, name the route before the industry does.
| Metric | How it gets gamed | What closes the route |
|---|---|---|
| 1. Care-dollar ratio | Inflate the numerator by paying affiliates above market — the exact mechanism p077 documents. Reclassify overhead as quality improvement, the p078 mechanism. Push volume into a non-consolidated joint venture. Raise the denominator's own costs, since the RFI concedes percentage-of-revenue rules "may have the effect of increasing incentives for insurance companies to raise their own costs" (p077) | Metric 2 (arm's-length re-pricing of affiliate payments) closes the first. A flat statutory prohibition on classifying utilization management as quality-improvement activity closes the second. Consolidation defined by control rather than ownership percentage, with joint ventures included, closes the third. Fee-per-member rather than percentage-of-spend caps close the fourth — that is Section 7's rank 3 lever, and this is its strongest justification |
| 2. Affiliate price differential | Restructure the affiliate transaction so no comparable unaffiliated service exists — bundle it, rename it, make it "proprietary." Route the payment through an unaffiliated intermediary that rebates the margin | Require a comparator or a cost-based justification; absent either, the payment is disallowed by default rather than litigated. Extend the disclosure to any intermediary with a financial relationship to the group, which is the p081 broker-relationship problem generalised |
| 3. Denial and overturn rates | Shift denials upstream into prior authorization so the claim is never filed and never denied. Deny in a category the taxonomy does not cover, which is what "other" already is. Manage the rate to just below a trigger threshold — Exhibit 2 rates threshold-based penalties only PARTIALLY DURABLE for exactly this reason. Suppress the overturn rate by making appeals harder rather than denials rarer | Report prior-authorization refusals and claim denials on one combined measure, so upstreaming shows up. Fix the reason taxonomy in regulation with a residual-category cap. Volumetric rather than threshold-based liability removes the incentive to sit under a trigger. Metric 4 catches suppression by friction |
| 4. Elapsed time | Reset the clock with a request for information — the RFI names this tactic itself at p053 and p060. Approve late and record it as an approval, which is how a denial disappears from denial statistics. Backdate the receipt timestamp | Every reset is a recorded, auditable event with a stated reason and a hard cap on resets per request. An approval outside the clinically relevant window counts as a denial for reporting purposes. Timestamps cross-validated against provider submission records, which makes backdating a two-party fraud rather than a filing choice |
| 5. Authorisations per patient per year | Bundle multiple authorisations into one request to lower the count. Move the friction from authorisation to documentation, where it is not counted | Count decision points, not forms. Require reporting of information requests and documentation demands alongside authorisations, which is Section 7.3's M3 patient-burden measure doing double duty |
And the general anti-gaming rule, because a list of routes is never complete. Any metric a regulated party computes from its own self-selected categories will be met without the underlying behaviour changing. So: categories fixed in regulation, not chosen by the filer; the burden of production on the party holding the documents; and a presumption against the plan where the data required to check a number is not supplied. That is three provisions, and they defeat more gaming than any amount of threshold tuning.
12.11.1 Making it implementable: a phased pilot, a fallback metric, and the statutory vehicle
Answer first: the care-dollar ratio has never been observed anywhere — Appendix A.6 says so, and that is the most obvious objection to this entire section. The answer is not to assert feasibility but to specify a route that starts with data that already exists, and a weaker metric that survives if the strong one proves unmeasurable. No cost estimate is offered here and none should be inferred; costing is the Committee's and CBO's work, not ours.
(a) A phased pilot, built only on reporting that exists today.
| Phase | What is required | Data already in existence |
|---|---|---|
| Phase 0 — feasibility, no new authority | Construct a proxy consolidated care-dollar ratio for a handful of large integrated groups from public filings, and publish the construction openly so it can be attacked | Medicare cost reports (HCRIS); MLR filings under 45 CFR Part 158; SEC segment and related-party disclosure in group annual reports; Medicare Advantage encounter data |
| Phase 1 — voluntary, limited scope | Invite consolidated groups to file the ratio for one market segment in one state, on a defined template, with the arm's-length comparator drawn from published price files rather than self-report | Transparency in Coverage machine-readable files (in-network negotiated rates); hospital price transparency files; state all-payer claims databases where they exist |
| Phase 2 — mandatory for a defined subset | Require the filing from groups above a size threshold, at consolidated level, with affiliate transactions reported transaction-by-transaction. This is the first phase that needs new authority | Phase 1 template, now with audit access to affiliate books |
| Phase 3 — general application | Extend to all groups in the federal markets; attach the penalty column of Exhibit 9 | — |
Two design points matter more than the sequencing. First, the comparator problem is solved by existing price files, not by a new survey: the Transparency in Coverage and hospital price-transparency datasets already publish negotiated rates by service and payer, which is precisely the unaffiliated benchmark metric 2 requires. Second, Phase 0 and Phase 1 are falsification stages, not construction stages. If the proxy ratio cannot be built from public filings, or if groups cannot file it on a template, that is a finding — and it should be published as one rather than absorbed.
(b) The fallback metric, computable today. If the consolidated ratio proves unmeasurable, the proposal should degrade rather than fail. The fallback is the affiliate price differential (Exhibit 9, metric 2) reported at the level of the licensed entity, alongside the MLR filing that entity already makes. It is weaker than the care-dollar ratio in three specific ways, and we state them rather than gloss them: it does not capture the denominator (cost-sharing, subsidies, affiliate fee income), it does not reach a non-consolidated joint venture, and it can be satisfied while the group's total capture rises. What it does do is close the single mechanism the RFI itself documents at p077 — margin relocated into an affiliate at a transfer price the group chooses — using a filing that already exists and a comparator that is already published. A partial instrument in force beats a complete instrument in a report.
(c) The statutory vehicle, with an honest split between what exists and what does not.
| Component | Authority | New authority required? |
|---|---|---|
| Reporting template and definitions for the MLR-adjacent filing | Public Health Service Act §2718 and the 45 CFR Part 158 rulemaking that implements it | No — regulation |
| Prohibiting classification of utilization management as quality-improvement activity | Same Part 158 rulemaking | No — regulation. This is why Section 7 ranks it where it does |
| Consolidated-parent scope, affiliate audit access, transaction-level affiliate reporting | — | Yes. Part 158 reaches the licensed issuer; reaching the parent and its affiliates is a statutory change |
| Extension to self-insured plans and their administrators | ERISA reporting authority | Yes for substantive scope; and it must be written federally — Gobeille v. Liberty Mutual, 577 U.S. 312 (2016), closed the state route |
| Penalties in Exhibit 9's last column | Existing civil monetary penalty and federal market-participation conditions | Mostly no; the volumetric denial liability is new |
The vehicle itself. Senate Finance holds Medicare, Medicaid and the tax code, and this RFI is explicitly the drafting predicate for the next reform bill (p002). The reporting components belong in that bill; the Part 158 components can be moved by rulemaking on a shorter clock and need not wait for it. Nothing above requires a new agency.
So what? The metric has no observed values, and that remains true. What the objection cannot survive is the sequencing: the first two phases are built entirely from data the federal government and the industry already publish, and they are designed to fail visibly if the metric is not constructible. That is the difference between an untested proposal and an untestable one.
The falsification test
Stated so that anyone can hold this report to it, including a hostile reader.
If, five years after enactment of any package consisting of coverage restorations, procedural prior-authorization reform, and disclosure without a cap attached, the audited consolidated-group care-dollar ratio has not risen by at least 5 percentage points from its first published baseline, the plan has failed — regardless of how many proposals were enacted, how much insurer margin was compressed, or how much reported MLR improved.
Our own prediction is that this is exactly what will happen to the RFI's package as drafted. Section 4B.6 states it: five years after enactment the care-dollar ratio will sit within ±2 percentage points of where it started, while insurer-reported MLR rises and reported administrative ratios fall. ANALYST. That divergence is the signature — the reported numbers improving while the real ratio does not move is what relocation looks like in a filing. The chief falsifier of our prediction, stated in 4B.6 and repeated here because it is the honest thing to do, is service-level affiliate benchmarking enacted at consolidated scope: if that passes and the care-dollar ratio still does not move, our mechanism is wrong, not merely incomplete.
Three subsidiary failure conditions, each observable and each dated. (1) Within two years of enactment, if no regulator has published a consolidated-group care-dollar ratio baseline, the plan has failed at step one — because everything else is unscoreable and the caps are being imposed on an unmeasured flow. (2) If MLR thresholds are raised before affiliate benchmarking and the quality-improvement-activity prohibition are in force, expect reported MLR to rise and the care-dollar ratio not to move — this is Section 7.5's sequencing trap, and it is the worst realistic outcome, because it would be announced as a win, deliver a measurable nothing, and then be quoted for a generation as proof that MLR regulation does not work. (3) If the commercial hospital price multiple has not fallen below 254 percent of Medicare in the markets where any benchmark instrument applies, the price base was not touched and the insurer reforms redistributed a total nobody constrained.
And the honest limit on all of it. The 5-point target is ANALYST. It is calibrated to clear the ±2-point null band from 4B.6 by a wide margin and to be roughly consistent with what the highest-ranked single lever should deliver on its own — about 4.8 percent of total revenue at the most integrated conglomerate, ESTIMATED per Section 7.2. We do not have a national derivation of a 5-point CDR gain, because no consolidated CDR exists to derive it from. An honest target with its reasoning on the table is worth more to the Committee than a precise-looking number with none.
So what? Every substantive component of this plan is already in the RFI, and every one of them is either behind the document's softest verb or outside its perimeter. The Committee does not need to be persuaded of anything. It needs to be told that its own document contains a diagnosis it has not acted on, that a cap on an unmeasured flow tells the industry where to move the money, that the largest number in the machine belongs to a hospital sector the document treats as a victim, and that if the care-dollar ratio has not moved five points in five years then whatever passed was not a reform. Write the measurement first, put the whole group and the whole chain inside the boundary, aim at capture rather than payout, and name the date on which the plan can be declared a failure. A plan that cannot fail cannot work.
Appendix A. Methodology, sources and value labels
A.0 How this analysis was made, and by whom
Phillip Alvelda and Thomas Ferguson
We have collaborated intermittently for some years at the intersection of health care and political economy. We make no claim to being expert about the American health care system's many moving parts, but we have been studying it for a long time and trying deliberately to comprehend it as a system. This memorandum is submitted as a working paper from our institutions, Brainworks and INET. It represents the views of no one but ourselves, and not those of any institution with which we are affiliated.
The analysis was produced by a small human team working with large language models, under human direction and human accountability. We state that here rather than at the front because the finding should be judged before the tooling is. The models' weaknesses are real and well known: they hallucinate, invent references, misread tables, and echo defective literature. Those failings are the reason for the citation discipline set out in the sections that follow, under which every number in this report is labelled by the kind of evidence behind it and no figure is asserted from a model's memory. The operative rule is the one stated at A.7: models are used to read, count, check, draft and challenge; published data is used to assert. Used that way, the method offers something a conventional reading of an eighty-six page document cannot — the capacity to hold a whole taxonomy against a whole text, to check every page rather than sample it, and to be argued with by an adversarial reader that does not tire on the fortieth pass.
We are aware that some members of this Committee have taken strong public positions against artificial intelligence, and we do not think those positions foolish. Much of the scepticism is well earned. But the industry under examination automated this work years ago. Coverage decisions affecting millions of people are already made at machine speed and machine volume by systems the patient cannot inspect and usually cannot identify; Section 8 documents what that produces, and Section 8.6a documents the same class of system running the hospital billing office on the other side of the claim. A rule against using these tools does not disarm the insurers. They own the compute, the claims data and the actuarial staff, and no legislature is going to take those away. It disarms only the parties trying to hold them to account. We would not urge anyone to trust these systems. We would argue that they should not remain a one-sided instrument.
A note on structure. Sections 1 through 12 are deliberately clinical: mechanism, measurement and remedy. Political questions are real, and pretending otherwise would be its own form of evasion — a measurement standard that cannot survive a markup is an academic exercise. We have nonetheless kept them out of this memorandum. The case rests on mechanism and measurement, and it should be assessed on whether the citations hold and the arithmetic closes, not on any judgment about motive. Nothing in the analysis depends on such a judgment.
What we owe in return, and we accept it. A tool that makes it cheap to produce voluminous, confident, plausible policy text also makes it cheap to produce voluminous, confident, plausible policy text that is wrong. Volume is not evidence and fluency is not accuracy. The discipline this document holds itself to is therefore stated as a rule rather than left to be inferred. Nothing here is asserted from model recall: sources were fetched and quoted. Every figure carries a label naming its evidence class — SOURCED, ESTIMATED or ANALYST — and a claim that cannot be sourced to submission standard is not asserted at all, rather than asserted with a hedge. Where the evidence cuts against our own positions it is recorded in the text at full strength: Section 4C.4 sets out eight such points, Section 4A.5a declines a national aggregate the rest of this debate is willing to quote, and Section 9.2a states a controlled result that is less useful to us than the uncontrolled one. We regard that as the minimum standard any submission of this kind should be held to, including by this Committee, and we would have it applied to ours.
An offer to the Committee, and to anyone else doing this work. The analysis is a live model, not a finished pamphlet. Because every figure is labelled by provenance and every quotation resolves to a page, a challenge to any specific claim can be traced to the exact assertion it touches, tested, and either incorporated or refused with a reason. Where a correction propagates — where changing one magnitude changes a ranking, a quadrant placement or a conclusion — the dependency can be followed through the document rather than patched at the surface. So the offer is concrete. If the Committee, its staff, or any party to this process disputes a number, supplies data we did not have, or wants the same analysis run against a different scope — a draft bill, an amended proposal, a specific state's market, a different extraction channel — we will integrate it and return a revised analysis with the changes marked. If a substantive critique defeats one of our findings, we will publish the correction with the same prominence as the original claim, because a measurement standard that cannot survive its own falsification test is worth nothing.
This offer is not partisan and is not conditional on agreement with our conclusions. It extends to the Committee's Republican members and staff on the same terms, to state regulators, to researchers, to patient and consumer organisations, and to the industries under examination — including hospital systems and insurers who believe our magnitudes are wrong and can show why. The relevant qualification is a willingness to argue from sources. The working files, verification log and quotation audit are available on request, so that anyone wishing to check this analysis can do so without asking our permission, and correspondence may be directed to the named authors at Brainworks.
We would rather state the method openly and be judged on whether the citations hold.
A.1 Value labels
Four labels are used in this report and no others.
| Label | Meaning |
|---|---|
| LIVE | Real-time measured value. |
| SOURCED | Published third-party figure, cited to its publisher. |
| ESTIMATED | Our calculation, with the derivation shown at the point of use. |
| ANALYST | Our judgment. Not a measurement and not presented as one. |
No fifth label appears anywhere in this document. Where a figure has no baseline, the report says so rather than supplying a placeholder — three of the five metrics in Exhibit 9 carry no baseline, and the exhibit states that in the baseline column.
A.2 Source document
Senate Finance Committee Democrats, "Health Coverage That Works For Everyone," Ranking Member Ron Wyden, July 30, 2026, 86 pages. Comments due October 2, 2026 to insurance@finance.senate.gov. The document identifies itself as the successor to the Committee's 2008 "Call to Action" (p002), the paper that preceded the Affordable Care Act.
The document was extracted to single-page text files, p001 through p086, where the file number is the
printed page number. Every [pNN] page cite in this report resolves to one of those pages.
A.3 Method
The RFI was assessed against the Brainworks extraction taxonomy in four steps.
- Page extraction. The 86-page document was extracted into 86 single-page text files, one per printed page, so that every claim in this report could be resolved to a page rather than to the document as a whole. Matching is newline-tolerant, because the extraction wraps mid-phrase.
- Keyword occurrence counting. Exhaustive counts across all 86 files for the vocabulary of each extraction channel — insurer terms, hospital and intermediary terms, technology terms, chronic-illness terms. Counts were taken from the files, not from a reading impression, and each count in the report was re-run rather than carried forward.
- Inversion of structure. The taxonomy is built first and the RFI is tested against it, not the reverse. That inversion is what makes an absence a finding: where the taxonomy names a quantified mechanism and the RFI is silent on it, the silence is evidence about the document's perimeter rather than a gap in our reading. This is why the report rates channels ABSENT, GESTURED AT, NAMED-UNREMEDIED or ADDRESSED rather than simply summarising what the RFI covers.
- Cite discipline. Every claim attributed to the RFI carries a page cite, and every quotation was checked against its cited page file. Where a claim is ours rather than the RFI's, it carries a label from A.1.
Ask strength was coded separately from subject matter, because the two diverge and the divergence is a finding: REQ-PROP for requests for drafted proposals, INV-FB for "invite feedback" or "invite comments," WELCOME for "welcome comments and analysis." Mixed language was coded to the weaker verb.
A.4 Verification protocol
Quotations were checked byte-identical against the cited page file after normalising quotation marks,
dashes, non-breaking spaces and the RFI's source-embedded footnote markers, which run digits directly against
words (the source reads the parent company,339 which…). Hard line-wrapping was flattened on both sides.
Ellipsis-elided quotations were split and each fragment required to appear. Quotations spanning a page break
were checked against both pages.
Current count: 201 distinct RFI-attributed quotations of six words or more carrying a page cite, all 201 verified against the source text. Earlier passes logged 205 and then 227 on different counting rules — the 227 figure counted ask-verb fragments of three to five words alongside the longer quotations. The 201 figure is a full recount on the stricter six-word rule and supersedes both. It is stated with its rule attached because the number is rule-dependent, and a single document should report a single number.
The recount extracted 210 candidate strings. Of the nine excluded, three are our own drafting quoted for contrast rather than RFI text, one is a paraphrase the report explicitly marks as such, two are third-party quotations correctly absent from the RFI, and three are extraction artefacts where the scanner joined the end of one quotation to the start of another. Four further quotations failed the automated match and verify on inspection: they span a page break with the footnote apparatus printed between the halves (p029-030, p063-064, p083-084) or sit in a paragraph the scanner truncated (p083).
Absence claims — terms the report states appear zero times — were confirmed by exhaustive grep across all 86 files rather than by sampling.
An honest note on the checker. The automated verifier produced two false mismatches from a
footnote-stripping regex that consumed digits inside larger numbers, breaking "nearly $1,000 per enrollee
annually in overhead and profit" (p071) and the p077 line-item disclosure quotation. Both quotations are
byte-identical to source; the fault was in the tool. It is recorded here rather than quietly fixed, because a
verification method that produces false positives will eventually be trusted when it produces a false
negative. A second, narrower class of apparent mismatch has the same cause: body text that runs across a page
break with a footnote block printed between the two halves. Those resolve once the footnote apparatus is
stripped, and they are quotation-extraction artefacts rather than errors in the report.
A.5 Working notes and audit trail
| Record | Contents |
|---|---|
| Pass 1 working notes | Page-by-page reading of all 86 pages, with verbatim quotations, ask-strength coding and the [pNN] verification marker on each. |
| Pass 2 working notes | The Brainworks Volume 2 extraction taxonomy inventory carried into this assessment, and the prior-work figures the report draws on. |
| Verification log | Claim-by-claim verification of framing statistics, figures and page cites against the page files. |
| Quotation audit | Method, running totals, mismatch resolution, absence-claim confirmations, and the checker's own recorded failures. |
| Register and voice log | Banned-construction list, per-section changes, justified survivors, figures wanted and not sourced, and the flagged tensions that were left alone rather than smoothed over. |
| Errata working file | The full evidence trail behind Section 4C.1a, including each source fetched and the verbatim text quoted from it. |
| Sourcing audit | Per-claim retrieval status for every external source, including those that could not be obtained and why. |
| External structured review, 30 July 2026 | The archived copy of Thomas Ferguson's Structured Analytical Review, Revised Edition, with its tables — the third-party document attributed at 4A.4c and relied on for the carried hospital figures. |
These records are maintained as part of our internal audit trail and are available on request.
A.6 Limitations
The spine metric has never been observed. No filing in the United States produces a consolidated-group care-dollar ratio, for any insurer, at any date. The central measurement standard of this report therefore has zero observed values anywhere in the world. That is the finding which puts measurement before caps in Section 12 — but it also means the 5-point threshold is calibrated against a null-band prediction rather than against data, and no national dollar figure for a 5-point gain can be derived. Both are stated ANALYST. What we do about it is set out at 12.11.1: a phased pilot whose first two stages are built only from reporting that already exists, a weaker fallback metric that can be filed today, and an explicit split between the components that need new statutory authority and those that do not. The limitation stands; the proposal is not left resting on it.
Four figures this analysis wanted and could not source. A systematic affiliate price-differential series — the 17 percent figure at p073 is one conglomerate, one service line, one press report. Elapsed-time data of any kind, for which no external source exists either, leaving Exhibit 9's metric 4 defined against no baseline. Authorisations per patient per year, for which no published dataset exists, which is why that metric sets no year-one target rather than inventing one. And denial or prior-authorization rates specific to long COVID, ME/CFS or other contested diagnoses, re-confirmed absent from published sources.
Hospital figures are carried, not re-derived. The hospital spending shares, growth contribution and commercial price multiples come from a separate structured analytical review of 30 July 2026 — by Thomas Ferguson, produced independently of Brainworks, attributed in full at 4A.4c — which states it verified them against public CMS, KFF, RAND, GAO and HHS data. We have not re-derived them, and the report says so at every point of use. Their value here is that they were produced by a different party, by a different method, using none of our figures, and reached the same conclusion.
This report grades a request for information, not legislative text. The RFI asks questions; it does not draft. Proposals may change, be dropped, or arrive in a bill in a form the document does not signal, and the ask-strength coding in particular measures what the Committee is currently willing to have drafted rather than what it will ultimately introduce. The critique is aimed accordingly: not at whether the RFI is wrong, but at what its perimeter leaves out and what its own evidence obliges any bill drawn from it to do.
A.7 How this analysis was produced
This section records the method in detail. We describe it because the reader is entitled to know it, and because the relevant publication standard requires it.
The models used. Analysis, drafting, structural criticism and adversarial review were performed using Anthropic Claude models — principally Opus-class models, with lighter models used for mechanical tasks such as counting, reformatting and consistency checking. Independent cross-checking of selected quantitative claims was performed with models from a different vendor family in order to reduce correlated error. Retrieval of public source material used conventional web search and document-fetch tooling, not model recall; no figure in this report originates from a model's unaided memory of a statistic.
What the models did. They read and re-read the source document; extracted and coded every request in it by subject and by the strength of the ask; performed exhaustive term-occurrence counts; assembled and checked the quotation set; drafted and redrafted prose; and — importantly — argued against the draft. Successive adversarial review passes were run with the explicit instruction to find factual contradictions, unsupported claims, arithmetic that did not close, and prose that would not survive a hostile reader. A number of substantive corrections in this document originate from those passes.
What the models did not do. They did not decide what the report concludes, and they were not permitted to supply a number. Every quantitative claim traces either to a published source with a citation or to arithmetic performed on published sources and shown in place. Where a model proposed a plausible figure without provenance, the figure was removed rather than sourced retrospectively. The distinction matters enough to state as a rule: this analysis uses models to read, count, check, draft and challenge, and uses published data to assert.
Human accountability. The named authors are accountable for every claim in this document, including claims first drafted or first challenged by a model. Judgments labelled ANALYST are the authors' judgments. Errors are the authors' errors.
No AI-generated images appear in this document. Every exhibit is a chart or table computed from the underlying data, and every photograph is a photograph.
Why it was done this way
The problem is combinatorial rather than merely large. Establishing what an 86-page policy document does and does not reach means holding it against a mechanism-level account of a $5.3 trillion sector, then tracking which of several dozen distinct extraction channels each of 71 discrete proposals touches, misses, or half-touches. No single one of those judgments is difficult. Making all of them consistently, with a page citation for every attributed claim and a source for every figure, is what defeats the conventional approach — and the characteristic failure it produces is not error but narrowing: a submission that treats the fragment it can hold properly and is silent on the rest. The silence then reads as consent.
That failure mode has a structural consequence for processes of this kind. The organisations best resourced to answer 71 proposals in full are the ones with a direct financial interest in the answer, and with standing government-affairs departments to do it. Everyone else — patient groups, academic centres, clinician associations, state regulators, small research programs — faces a choice between responding to a fragment properly and responding to the whole thing thinly. The result is that the most comprehensive submissions a committee receives tend to come from the parties with the most to lose from comprehensive reform. That is not a complaint about this Committee. It is a standing feature of notice-and-comment democracy, and it is usually invisible, because the submissions that were never written leave no trace. It is one reason the diagnostic literature on healthcare extraction is voluminous while the enforceable-measurement literature is nearly empty, and one reason a request for information can run to 86 pages on insurer conduct without once using the words "facility fee," "provider consolidation," "market power," "monopoly," "antitrust" or "algorithm."
This submission is an attempt to answer the whole thing. Every one of the 71 proposals is rated individually in Section 11; the Committee's own source documents were retrieved and read rather than summarised; federal data series were pulled from primary endpoints and cross-validated against a second independent source. The finished memorandum carries 382 individually labelled quantitative claims, 201 byte-verified quotations, 77 distinct page citations into the source document, 65 external primary sources and eleven computed exhibits, supported by working files — verification logs, a quotation audit and the supporting research — retained so that the work can be checked rather than trusted.
The method does not make the analysis correct. That is what the citation discipline, the verification log and the adversarial passes are for, and the limitations at Appendix A.6 record where we failed. The verification burden per claim here is higher than a conventional submission's, not lower, because every quotation is checked byte-identical against its printed page and every figure carries a label stating what kind of thing it is. What the method does is make a comprehensive, transparent and independently checkable response possible for a party without a government-affairs department. Every claim in it can be checked against a page number or a published source.
Appendix B. Bibliography
Every source cited anywhere in this document, with a live link to the original material. Entries are generated directly from the links in the text, so this list cannot drift from what the report actually cites.
On link validation. Every URL below was fetched and checked on 2026-07-31. Checking a link is not the same as checking that it returns the document it claims to return, and an HTTP 200 response proves only that a server answered: sites that have moved commonly answer with a homepage rather than an error. Each link here was therefore confirmed by inspecting the returned content, not merely its status code. One consequence is worth stating plainly: the 19 federal lobbying disclosures are cited on the current host. The Senate Lobbying Disclosure Act site moved from lda.senate.gov to lda.gov, and the old filing URLs answer HTTP 200 while silently serving the site homepage instead of the filing. Every filing link below was confirmed to return the specific filing, identified by registrant and client.
Where a source sits behind a paywall or blocks automated access, that is stated in the entry. Where our own access to a source failed, that is stated too, in Section B.4.
B.1 The source document
United States Senate Committee on Finance, Democratic staff, "Health Coverage That Works For Everyone" — request for information, 30 July 2026, 86 pages. Comments close 2 October 2026. This is the document under analysis; every page citation of the form p0NN refers to its printed pages, extracted to 86 single-page text files for verification (Appendix A.2). Distributed by the Committee; the covering Dear Colleague letter of 19 March 2026 is public.
B.2 Federal analytical bodies (GAO, MedPAC, CMS, CBO)
- 1. GAO-25-107450, HEALTH CARE CONSOLIDATION: Published Estimates of the Extent and Effects of Physician Consolidation Cited in §4A.4a.
B.3 Peer-reviewed studies cited directly
B.4 Sources relied on in Sections 1 through 12
Sections 1 through 12 carry their quantitative load on published work by CMS, KFF, RAND, GAO, MedPAC and peer-reviewed authors. Those citations were originally given by institution and figure rather than by hyperlink, because the hospital magnitudes are carried from a prior structured review rather than re-derived here (Appendix A.6). The canonical primary sources are listed below so that a reader can check each figure at its origin. Each was fetched and its content compared against the claim it supports; the confidence marker records the result of that comparison rather than a status code.
The full working record of this resolution, including the sources we could not pin to a specific publication and the reasons, is retained in our institutional-bibliography working file and available on request.
- 3. RAND — Hospital Price Transparency Study, Round 5 (2022 data) — link · link · link — content confirmed against the claim.
- 4. CMS — National Health Expenditure Accounts (NHEA), Historical — link — content confirmed against the claim.
- 5. KFF — "Hospital Spending Accounted for 40% of the Growth in National Health Spending Between 2022 and 2024" — link — content confirmed against the claim.
- 6. KFF — "Hospital Prices Have Risen Much Faster for Private Insurance Than Medicare Since 2019" (Godwin & Levinson) — link — content confirmed against the claim.
- 7. KFF — "Medicare Advantage Insurers Made Nearly 53 Million Prior Authorization Determinations in 2024" — link — content confirmed against the claim.
- 8. KFF — Claims Denials and Appeals in ACA Marketplace Plans (Pollitz et al.) — link — content confirmed against the claim.
- 9. KFF — Employer Health Benefits Survey 2024 — link — content confirmed against the claim.
- 10. KFF Health News — "In Fight Over Medicare Payments, the Hospital Lobby Shows Its Strength" (site-neutral payment) — link — content confirmed against the claim.
- 11. MedPAC — March 2025 Report to the Congress: Medicare Payment Policy — link · link — content confirmed against the claim.
- 12. GAO — GAO-25-107450, Health Care Consolidation: Published Estimates of the Extent and Effects of Physician Consolidation (September 2025) — link · link — content confirmed against the claim.
- 13. CBO — Cost estimate, H.R. 5378, Lower Costs, More Transparency Act — link · link — correct document identified; publisher blocks automated inspection of the specific figure.
- 14. Health Affairs — Abraham, Cook & Sirmans, ASO market serving self-insured employers — link — correct document identified; publisher blocks automated inspection of the specific figure.
- 15. Health Affairs — Mello et al., AI in health insurance utilization review — link — correct document identified; publisher blocks automated inspection of the specific figure.
- 16. JAMA — Angus et al., JAMA Summit Report on Artificial Intelligence — link · link — correct document identified; publisher blocks automated inspection of the specific figure.
- 17. Commonwealth Fund — The Federal Employee Health Benefits Program: A Model for Workers, Not Medicare (2003) — link · link — correct document identified; publisher blocks automated inspection of the specific figure.
Not pinned to a single publication. The following citations could not be resolved to one specific product with confidence, and are recorded here rather than given a link we cannot stand behind: RAND — hospital services as ~42% of privately-insured spending, 2022. The underlying figures remain as labelled at their point of use in the text.
B.5 Brainworks healthcare research (our own published volumes)
Figures derived from our own extraction model are cited to the volume that publishes them, so the reader can reach the underlying analysis and its references. These are our work, not third-party corroboration, and should be read as such.
- 18. Brainworks Ventures, Volume 2 - The Extraction Machine: How American Healthcare Converts Patient Dollars to Corporate Profit Own published work, 406 numbered references. Every figure in this pattern was confirmed present in the live document.
- 19. Brainworks Ventures, Volume 1 - US Healthcare Economic Extraction Model & Birth Cohort Dynamics Own published work, 37 external references.
- 20. Brainworks Ventures, Volume 3 - Part III: Legislative Strategy to Reform American Healthcare v3.0 Own published work.
- 21. Brainworks Ventures, Long COVID Mechanistic Pathway Atlas v3.2 Own published work. NOTE: the /longcovid/methodology.html, /bibliography.html and /manuscript.pdf links on the reports index all 404 - only the atlas itself resolves.
B.6 Sources for figures attributed in the text by publisher name
Some figures in the body name their publisher in prose rather than carrying a hyperlink. Each source below was fetched and inspected against the specific figure it supports; where the check produced a caveat, the caveat is stated rather than dropped.
- 22. "School Difficulties and Long COVID in Children and Adolescents," Academic Pediatrics, 2026 Jul Cited for the educational-absenteeism dimension only.
- 23. Behnood SA, Shafran R, Bennett SD, et al., "Persistent symptoms following SARS-CoV-2 infection amongst children and young people: A meta-analysis of controlled and uncontrolled studies," Journal of Infection 84(2):158-170, 2022 CONFIRMED verbatim from PubMed. 22 studies, 23,141 children, median follow-up 125 days. Controlled pooled risk differences significant only for loss of smell 8% (2-15), headache 5% (1-8), cognitive difficulties 3% (1-4), sore throat 2% (1-2), sore eyes 2% (1-3); NOT significant for fatigue, cough, myalgia, insomnia, dyspnoea, dizziness, fever, diarrhoea, abdominal pain. Uncontrolled pooled prevalence 15%-47%. Higher study quality associated with LOWER prevalence. Authors' conclusion quoted on the critical importance of a control group.
- 24. Borch L, Holm M, Knudsen M, Ellermann-Eriksen S, Hagstroem S, "Long COVID symptoms and duration in SARS-CoV-2 positive children — a nationwide cohort study," European Journal of Pediatrics 181(4):1597-1607, 2022 CONFIRMED verbatim from PubMed. Denmark nationwide; 37,522 SARS-CoV-2 positive children vs 78,037 controls. 0.8% excess reporting symptoms >4 weeks vs controls. Authors' conclusion quoted: 'Long COVID in children is rare and mainly of short duration.' Notes concentration difficulties, headache, muscle and joint pain and nausea were NOT distinguishable from control rates.
- 25. Buonsenso D, "Long COVID is here to stay — even in children," The Lancet Infectious Diseases 26(2):112-113, February 2026 (linked commentary Commentary accompanying the RECOVER-EHR reinfection cohort. Author discloses grants from Pfizer and Roche to study long COVID. Treated as commentary, not as an independent evidentiary source.
- 26. Cai M, Xie Y, Topol EJ, Al-Aly Z, "Three-year outcomes of post-acute sequelae of COVID-19," Nature Medicine, 2024 Jun CONFIRMED verbatim: cohort of 135,161 infected and 5,206,835 controls; 9.6 DALYs per 1,000 in year three among non-hospitalised, 90.0 per 1,000 among hospitalised.
- 27. Committee for a Responsible Federal Budget
- 28. Cooper Z, Nguyen H, Shekita N, Scott Morton F, "Out-Of-Network Billing And Negotiated Payments For Hospital-Based Physicians," Health Affairs 39(1), 2020; institutional summary, Yale School of Management $40B/yr in employer-insured spending, chiefly systemic IN-NETWORK price inflation extracted under threat of OON billing, 2015 basis. Health Affairs blocked automated retrieval; quoted verbatim from the authors' own institutional summary and disclosed as such.
- 29. CVS Health Corporation, DEF 14A proxy statement filed 2025-04-04 (FY2024 Summary Compensation Table CONFIRMED: Karen Lynch FY2024 SCT total $23,431,466 - the former CEO, prior year.
- 30. CVS Health Corporation, DEF 14A proxy statement filed 2026-04-03 (FY2025 Summary Compensation Table CONFIRMED: Joyner FY2025 SCT total $21,214,084; CAP $50,482,415.
- 31. Drug Channels Institute, "The 340B Program Reached $66 Billion in 2023," October 2024, using HRSA covered-entity purchase data and IQVIA list-price values Gross list-to-340B spread $124.1B - $66.3B = $57.8B, which DCI states approximates the money collected by 340B covered entities. HRSA's own page returned 403 to automated retrieval; figure taken from DCI's published derivation.
- 32. Ford ND, Simeone RM, Pratt C, Saydah S, "Functional Limitations and Illness-Related Absenteeism among School-Aged Children with and without Long COVID, United States, 2022-2023," Emerging Infectious Diseases 31(14), 2025 CONFIRMED verbatim from PMC full text. Nationally representative NHIS sample of 11,057 children aged 5-17; 4,587 with prior COVID-19. ~1.4% of school-aged children ever had long COVID. Functional limitation including memory difficulty 18.3% vs 8.6%. Adjusted odds of illness-related chronic absenteeism (>18 school days missed for health reasons) 2.4 (95% CI 1.4-4.2) controlling for chronic health conditions and 2.3 (1.4-4.0) controlling for neurodevelopmental conditions.
- 33. Gross RS, Thaweethai T, Kleinman LC, et al. (RECOVER-Pediatrics Consortium), "Characterizing Long COVID in Children and Adolescents," JAMA, 2024 Aug 21 CONFIRMED verbatim from PubMed abstract: 898 school-age children and 4,469 adolescents, >60 US sites, 14 prolonged symptoms more common after infection, affecting almost every organ system.
- 34. Gross RS, Thaweethai T, Salisbury AL, et al. (RECOVER-Pediatrics Consortium), "Characterizing Long COVID Symptoms During Early Childhood," JAMA Pediatrics 179(7):781-792, 2025 CONFIRMED verbatim from PubMed. 472 infants/toddlers (278 infected) and 539 preschool-aged children (399 infected), >30 US sites. 40/278 (14%) of infected infants/toddlers and 61/399 (15%) of infected preschoolers classified as probable long COVID on derived indices. Symptom patterns distinct between age groups and from older children. JAMA Network returned HTTP 403 to automated retrieval.
- 35. Health Care Cost Institute CONFIRMED but NARROW: HCCI adult primary-care E&M office visits, 2022 only ($116 -> $217). Not a general all-services rate; HCCI cross-service range is 1.27x-13.5x.
- 36. HHS, Consolidation in Health Care Markets RFI response report
- 37. Himmelstein, Campbell & Woolhandler, Annals of Internal Medicine 2020;172(2):134-142 DOC-IDENTIFIED-403: publisher blocked automated retrieval; figure corroborated across indexes. 2017 data.
- 38. KFF CONFIRMED. 2020 data published 2023 - do not present as current.
- 39. KFF, "Half of Emergency Ambulance Rides Lead to Out-of-Network Bills for Privately Insured Patients," analysis 51% of emergency ground-ambulance transports for privately insured patients result in out-of-network bills; ground ambulances excluded from the No Surprises Act.
- 40. Kuperwasser C, El-Deiry WS, "COVID vaccination and post-infection cancer signals: Evaluating patterns and potential biological mechanisms," Oncotarget 17:1-29, 3 January 2026 EXAMINED AND DELIBERATELY NOT USED. 69 publications, 333 patients, 27 countries; population cohorts Korea ~8.4M, Italy ~300,000, ~1.3M US military. Two disqualifying features for this submission: (1) the authors characterise the evidence base as 'an early phase of potential safety-signal detection' and call for the epidemiological work needed to establish whether a link exists; (2) the review treats COVID-19 INFECTION and COVID-19 VACCINATION as a single combined exposure, so no infection-attributable signal can be extracted. Cited here only to document why the cancer-acceleration claim is not asserted.
- 41. Mandel H, Yoo YJ, Allen AJ, et al. (RECOVER Initiative), "Long COVID Incidence Proportion in Adults and Children Between 2020 and 2024: An Electronic Health Record-Based Study," Clinical Infectious Diseases 80(6):1247-1261, 2025 CONFIRMED verbatim: 'Overall, 4% of children and 10%-26% of adults developed long COVID'; excess incidence 1.5% in children.
- 42. MedPAC, March 2026 Report to the Congress, Ch. 12 CONFIRMED. March 2026 edition, not March 2025.
- 43. Milliman, "Addiction and mental health vs. physical health: Widening disparities in network use and provider reimbursement," 2019 Behavioral care 5.2x more likely out-of-network than medical/surgical; behavioral providers reimbursed 23.8% below primary care on identical codes.
- 44. Morra et al., 'US Physician Practices Versus Canadians: Spending Nearly Four Times As Much Money Interacting With Payers', Health Affairs 30(8):1443-50 (2011 CONFIRMED via PubMed abstract: '$22,205 per physician per year' and '$82,975 per physician per year'. NOTE: 2011 data, Ontario only, per physician per year - NOT per claim. Corrects a prior misattribution to Himmelstein et al. 2020.
- 45. Pinto Pereira SM, Nugawela MD, Stephenson T, et al. (CLoCk Consortium), "Post-Covid-19 condition (Long Covid) in children and young people 12 months after infection or reinfection with the Omicron variant: a prospective observational study," Scientific Reports 14, 2024 CONFIRMED verbatim from PubMed. CUTS AGAINST OUR REINFECTION ARGUMENT and is cited for that reason. 345 CYP aged 11-17 with first Omicron infection vs 360 reinfected. At 12 months 17.4% of first-positives and 21.9% of reinfected met the research Long Covid definition, p=0.13 (not significant). Symptom profiles, severity and impact similar between groups. Authors: clinicians 'may not therefore need to consider number of infections and type of variant when developing treatment plans.'
- 46. Premier Inc CONFIRMED. Premier says insurers process 'about three billion medical claims annually' - do NOT pair its per-claim cost with the RFI's 9 billion operand.
- 47. Private Equity Stakeholder Project CONFIRMED. Advocacy publisher; PESP itself writes 'reportedly'. The $9B is bankruptcy-filing liabilities incl. $6.6B MPT lease obligations, not borrowings.
- 48. Senate Committee on Finance, Majority Staff, "Majority Study Findings: Medicare Advantage Plan Directories Haunted by Ghost Networks," May 3, 2023 CONFIRMED by direct read of the 8-page PDF. 120 calls, 12 MA plans, 6 counties, mental health only. 82% ghost listings (Appendix Table 1); appointments secured 18% of the time, falling to 13% excluding third-party matching services. Contains NO profit-motive language; framed as accuracy + CMS oversight failure.
- 49. Stephenson T, Pinto Pereira SM, Nugawela MD, et al. (CLoCk Consortium), "A 24-month National Cohort Study examining long-term effects of COVID-19 in children and young people," Communications Medicine 4(1):255, December 2024 CONFIRMED verbatim from PubMed. England; 31,012 eligible 11-17-year-olds PCR-tested Sept 2020-Mar 2021, 12,632 participating (40.7% response). Delphi research PCC definition operationalised. 7.2% consistently fulfil the PCC definition at 3, 6, 12 AND 24 months, median 5-6 symptoms. CRITICAL CONTROL FINDING: between 20% and 25% of ALL infection-status groups — including never-infected — report 3+ symptoms at 24 months.
- 50. The Cigna Group, DEF 14A proxy statement filed 2026-03-13 (FY2025 Summary Compensation Table CONFIRMED by direct parse of the filing: Cordani FY2025 SCT total $22,866,134; CAP $14,585,303; realized $18,543,068. No ~$51M figure present.
- 51. UnitedHealth Group, DEF 14A proxy statement filed 2025-04-21 (FY2024 Summary Compensation Table CONFIRMED: Andrew Witty FY2024 SCT total $26,339,215.
- 52. US Bureau of Labor Statistics, "Population Level" / civilian noninstitutional population aged 16 and over (series CNP16OV), monthly; retrieved via FRED, Federal Reserve Bank of St. Louis USED AS THE MATCHING DENOMINATOR for LNU00074597 so that disability prevalence is expressed as a share rather than a raw count. Both series are CPS-based and share population controls, so the ratio is denominator-consistent. Derived shares: 2016-2019 mean 11.79% (range 11.45-12.06); Feb 2020 11.93%; 2023 mean 12.55%; 2025 mean 12.89%; Jun 2026 13.41%. Rise vs the flat 2016-2019 mean = +1.63pp, ~4.47 million persons at the latest population level. 55 of the 59 months since Jul 2021 exceed the highest pre-pandemic month. CONSERVATIVE COMPARATOR CHOSEN DELIBERATELY: a linear fit to the pre-pandemic segment has a NEGATIVE slope (-0.0030pp/month), so extrapolating it to Jun 2026 gives an 11.49% counterfactual and a larger 1.92pp / ~5.3M gap. That figure is disclosed in the text and explicitly NOT used or plotted, because projecting a declining trend forward six years manufactures part of the claimed gap. January population-control revisions checked: range -820k to +393k, insufficient to generate the shift. Exhibit 8 is rendered from a local cache of both primary series.
- 53. US Bureau of Labor Statistics, Current Population Survey, "Population Level - With a Disability, 16 Years and over" (series LNU00074597), monthly, not seasonally adjusted, June 2008 - June 2026; retrieved via FRED, Federal Reserve Bank of St. Louis RETRIEVED AND COMPUTED FROM THE FULL PRIMARY SERIES (216 monthly observations), not read from a chart image. Cross-confirmed against the BLS public API v2 for the same series id (REQUEST_SUCCEEDED, 120 observations, Dec 2025 = 36,199 thousand). Key values: 2016-2019 mean 30,212k; Feb 2020 30,972k; 2021 mean 31,084k; 2023 mean 33,501k; 2025 mean 35,286k; Jun 2026 36,905k. Level change vs Feb 2020 +5,933k (+19.2%). Pre-pandemic monthly slope ~+10k; 2021-2026 slope ~+88k. Series counts self-reported disability of ANY cause and is NOT a long COVID measure.
- 54. US Bureau of Labor Statistics, Current Population Survey, "Population Level - With No Disability, 16 Years and over" (series LNU00074593), monthly, not seasonally adjusted, June 2008 - June 2026; retrieved via FRED, Federal Reserve Bank of St. Louis USED AS THE COUNTERFACTUAL GROWTH BASELINE in Exhibit 8 Panel B, at Phillip Alvelda's suggestion, so the shaded excess is measured against how the non-disabled population actually grew rather than against a zero axis. Retrieved in full (216 monthly observations). CONFIRMED COMPLEMENTARY: LNU00074593 + LNU00074597 = CNP16OV at every month to within 1 thousand (rounding); the build script asserts this and fails loudly if BLS redefines either series. Because they are complementary, their SHARES are exact mirror images and are deliberately not plotted together on a share axis, which would imply two independent measurements where there is one. Indexed to Feb 2020 = 100: by Jun 2026 the disabled population is +19.2% against +4.2% for the non-disabled, a factor of ~4.6. Counterfactual: 30,972k x (238,261/228,657) = 32,273k vs actual 36,905k, excess ~4.63M -- an independent method landing within 3% of the flat-mean estimate of ~4.47M. LIMITATION DISCLOSED IN BOTH CAPTION AND TEXT: the spread was already widening pre-pandemic at ~+0.089 index points/month (2016-01 to 2020-02) versus ~+0.208 after (2021-06 on), so the pandemic represents a ~2.3x acceleration of an existing divergence, not its origin; population ageing plausibly explains much of the earlier drift.
- 55. Vahratian A, Adjaye-Gbewonyo D, Lin JS, Saydah S, "Long COVID in Children: United States, 2022," NCHS Data Brief No. 479, National Center for Health Statistics, September 2023 CONFIRMED from the NLM record. Parent-reported 2022 NHIS; Long COVID defined as symptoms >=3 months after COVID-19 among children with a positive test or physician diagnosis. cdc.gov and stacks.cdc.gov both returned HTTP 403 to automated retrieval; figures cross-confirmed against the CDC EID article (PMC12829551), which cites the 2023 NHIS round as 1.0% of children 6-11 and 2.3% of children 12-17.
- 56. Zhang B, Wu Q, Jhaveri R, et al. (RECOVER Consortium), "Long COVID associated with SARS-CoV-2 reinfection among children and adolescents in the omicron era (RECOVER-EHR): a retrospective cohort study," The Lancet Infectious Diseases 26(2):127-138, February 2026 CONFIRMED verbatim from PubMed. 40 US children's hospitals; 465,717 eligible; 407,300 first-infection and 58,417 second-infection episodes, Jan 2022-Oct 2023. PASC (U09.9) incidence 903.7 per million per 6 months after first infection vs 1,883.7 after second; RR 2.08 (1.68-2.59). 21 further symptom/condition categories elevated, RR 1.15-3.60, including myocarditis, heart disease, arrhythmias, chest pain, thrombophlebitis and thromboembolism, acute kidney injury, POTS/dysautonomia, cognitive impairment. Lancet website returned HTTP 403 to automated retrieval; abstract taken from the NLM PubMed record.
- 57. Zheng YB, Zeng N, Yuan K, et al., "Prevalence and risk factor for long COVID in children and adolescents: A meta-analysis and systematic review," Journal of Infection and Public Health 16(5):660-672, May 2023 CONFIRMED verbatim from PubMed. 40 studies, 12,424 individuals; pooled prevalence of any long COVID 23.36% (95% CI 15.27-32.53) among infected children. By follow-up: 26.41% at 3-6 months, 20.64% at 6-12 months, 14.89% beyond 12 months. Cited in this report as the HIGH end of the methodological range and explicitly NOT relied upon, because the pool is dominated by uncontrolled studies — see the CLoCk and Behnood control findings.
in response to the Request for Information of July 30, 2026. It is submitted
to insurance@finance.senate.gov and may be circulated and cited freely.